Systems & graphics engineeringSolo designer and engineerDrawing 25 of 33
Velm
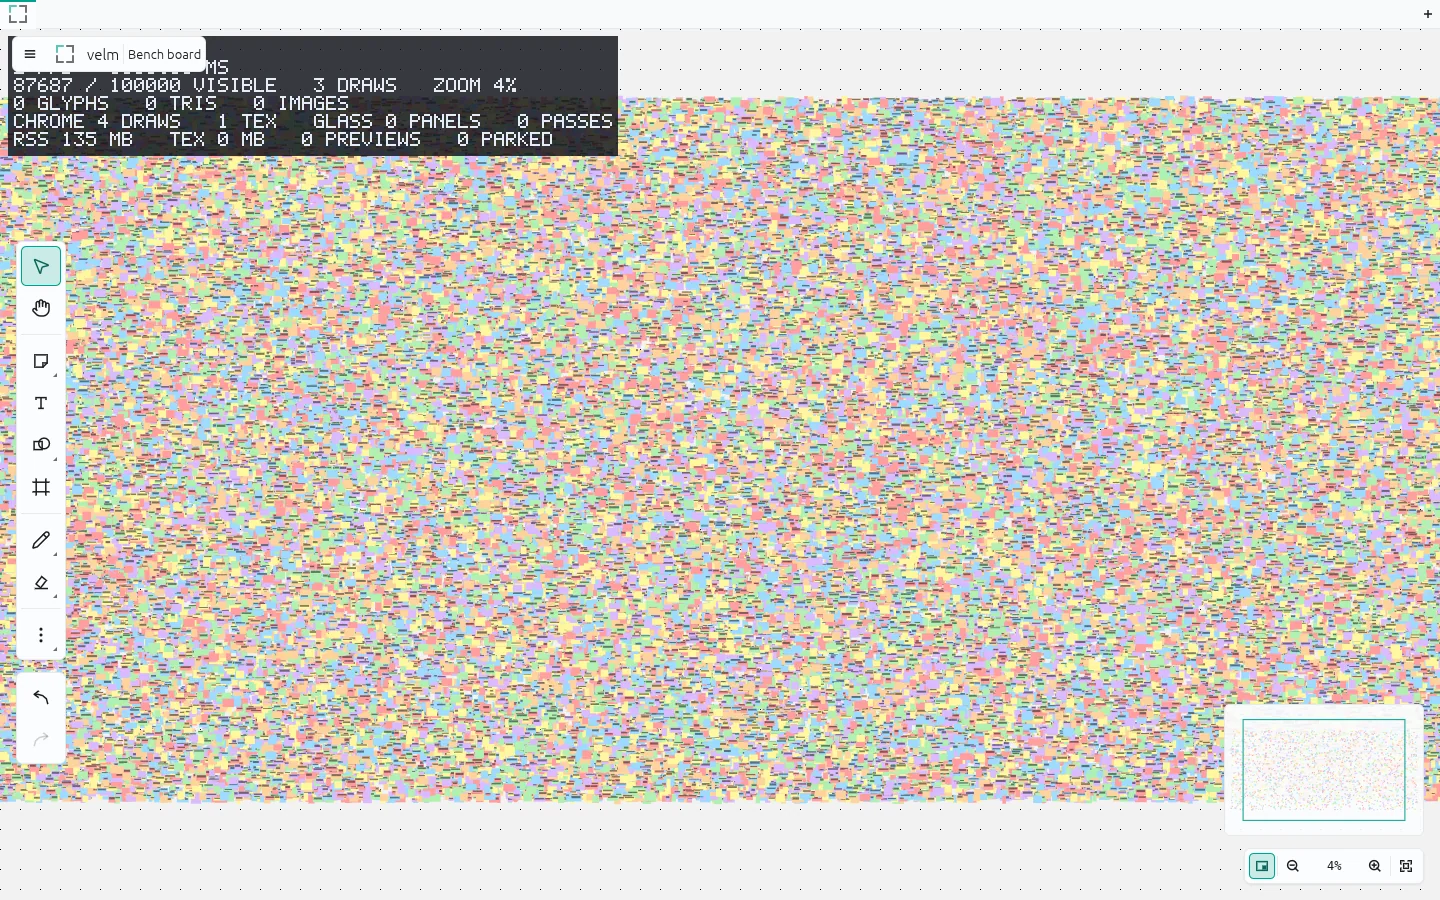
I built a native infinite-canvas app in Rust to replace Miro on my own machines. The whole thing rests on one rule: a frame should cost what is on screen, not what exists on the board.
- StatusEssentially done, 2026
- Built withRust, wgpu, Loro CRDT, SQLite, 18 crates
- Runs onmacOS and Windows, no webview
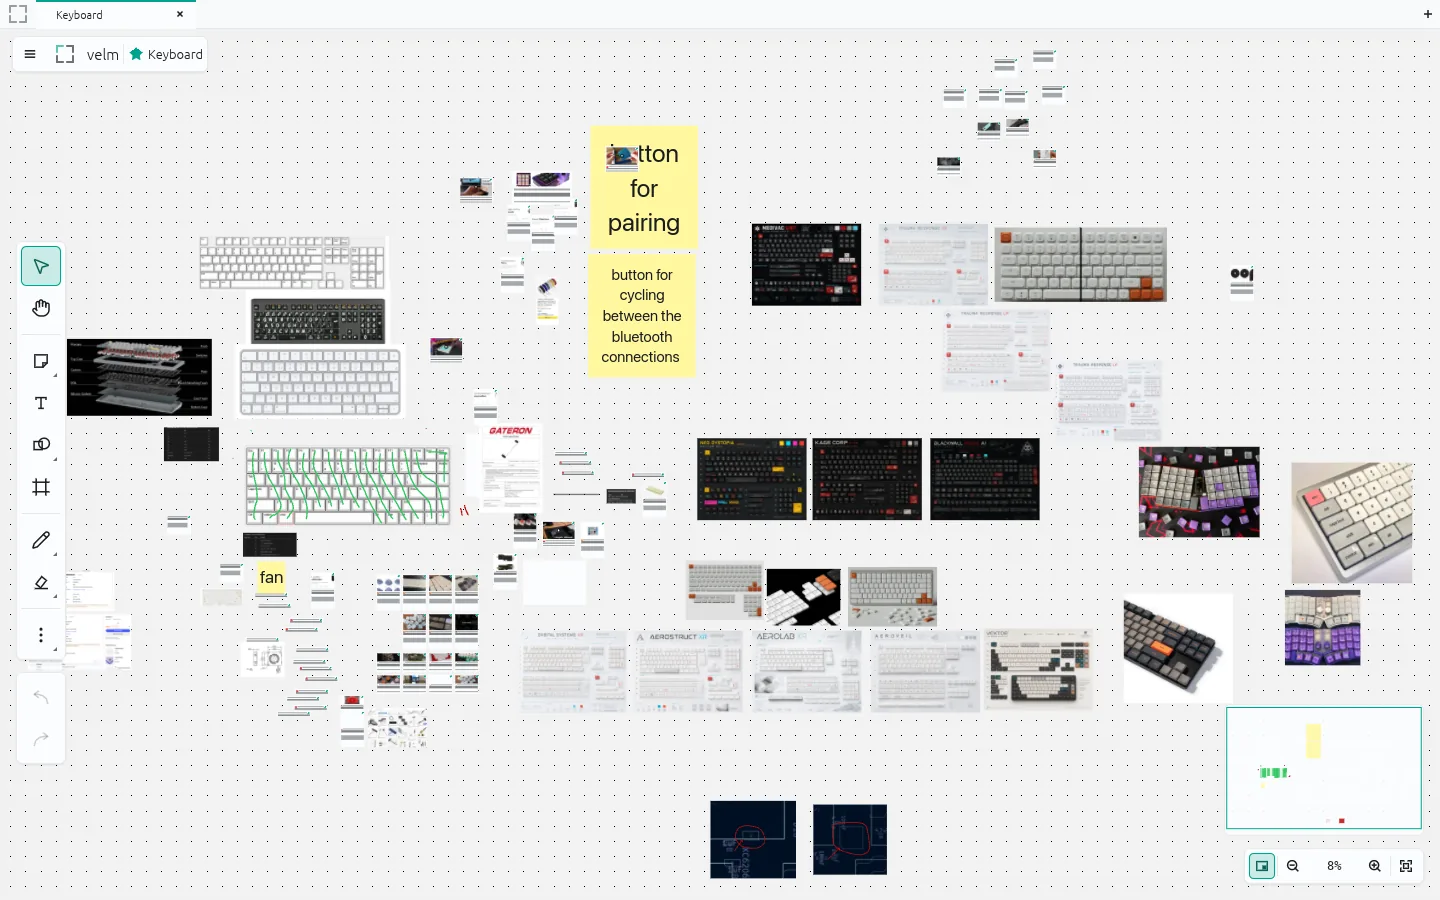
- Reference boarda real 596-widget Miro import
Sheet 02 of 05/Why
Miro got slow, and it was the wrong kind of slow
Miro had become the slowest thing on my computer, and what bothered me was that it stayed slow in proportion to how much existed on the board, not how much I was actually looking at.
Sheet 03 of 05/Parts
Issued as separate drawings
This project is more than one project. Each part below is its own set, with its own sections and pictures.
Part 01 / 02
The engine
A frame costs what is on screen and nothing else. Culling, instanced draws, no webview, and the three ceilings that are still there.
Part 02 / 02
Miro import
Getting fifty eight boards out of a format that was never meant to leave, and proving they arrived.
Sheet 04 of 05/Scope
Two things I cut on purpose
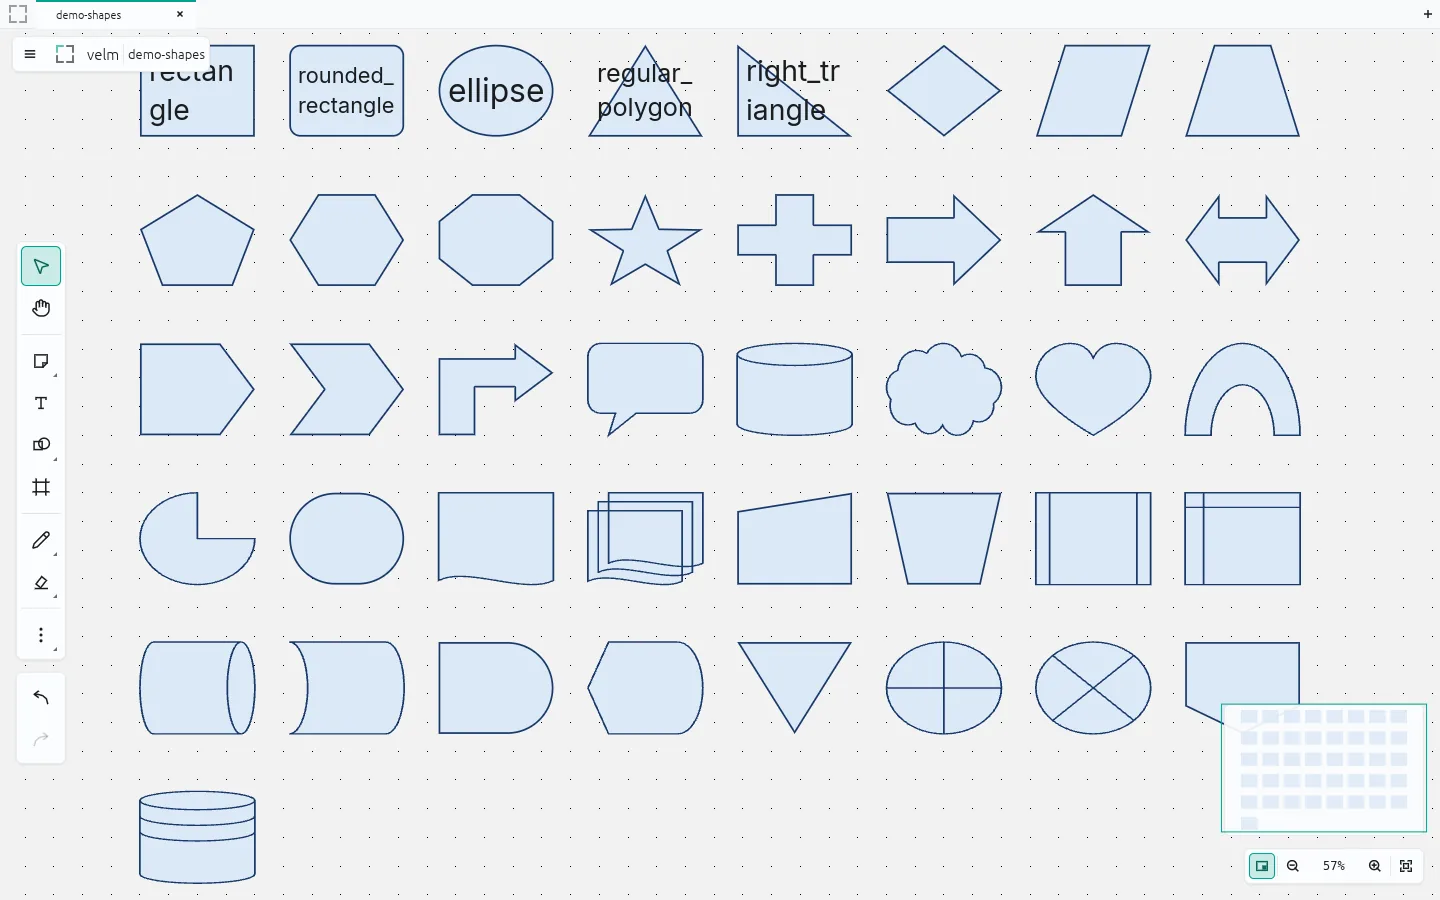
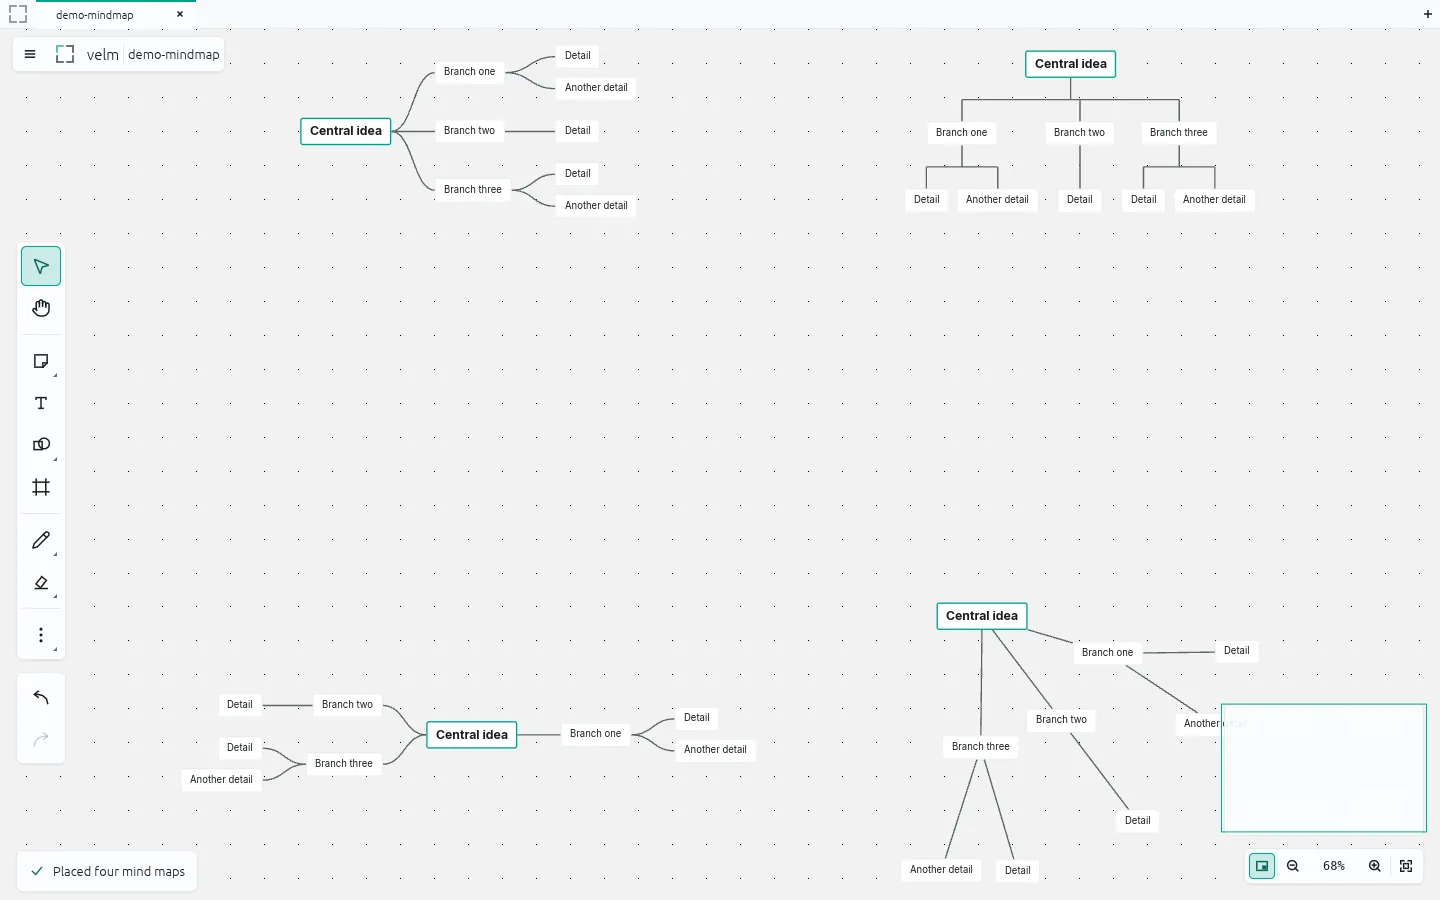
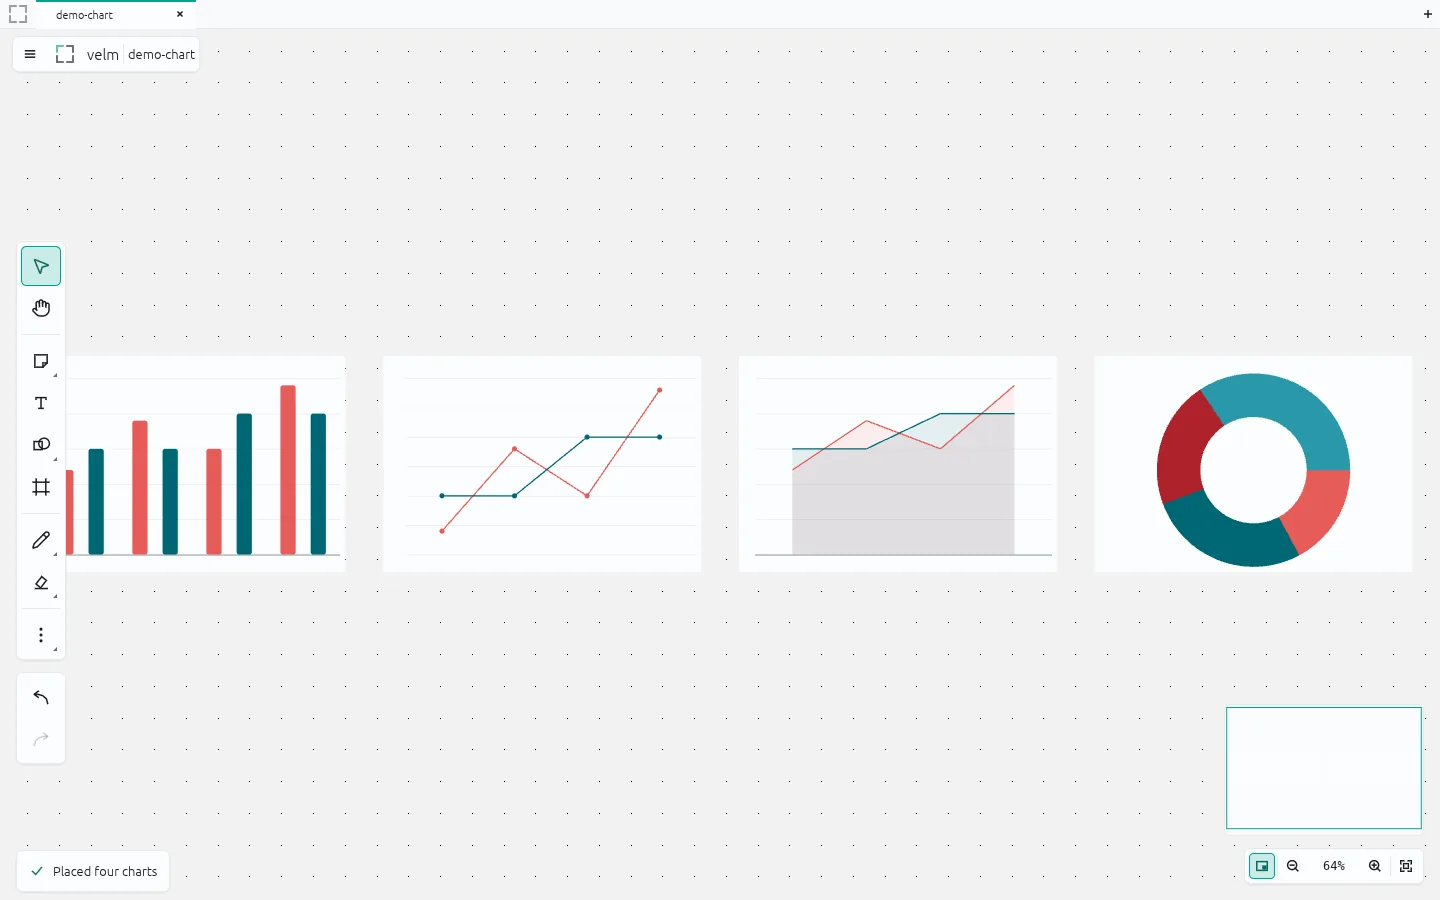
Collaboration's gone completely and there's no dark mode yet, but it's still a real tool underneath that: 41 shapes, mind maps, and charts you can drop right on the board.