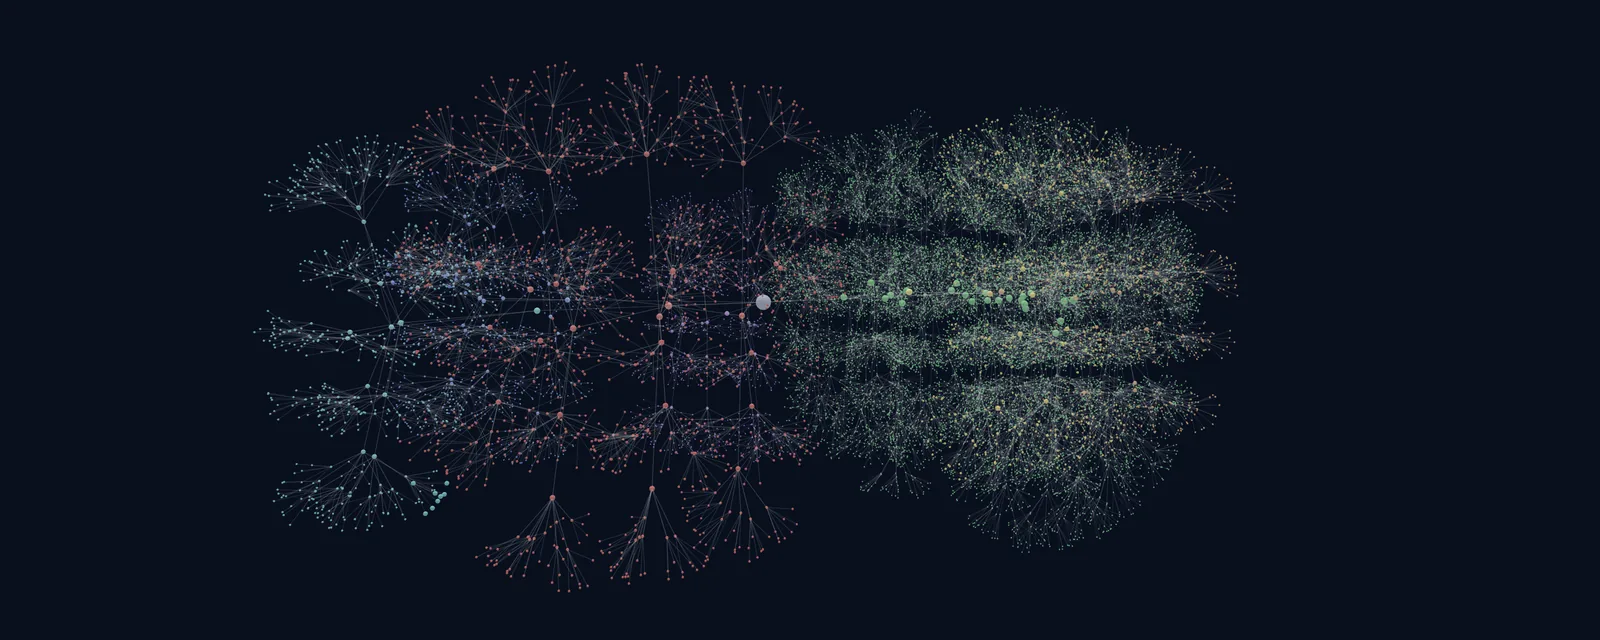
A dark navy field holding a wide cloud of thousands of small dots and thin lines, branching out from one grey node in the middle, with red, blue and teal clusters on the left and a dense green cluster on the right

Client web appSole developerDrawing 38 of 43

xPM Process
Library

I built a browser app for xPM, a construction project management company, that turns their library of 16,703 construction processes into a 3D graph and seven other views.

Sheet 02 of 09/Client

Who I built it for

xPM is a construction project management company working on an AI platform, and their work is organised around a library of processes. Each entry is a process, form or template that someone on a construction project works through, filed under a stakeholder group, a contractor, a stage and a sub-stage. The app was meant to live on xPM's site, and I took its colors and logo from there.

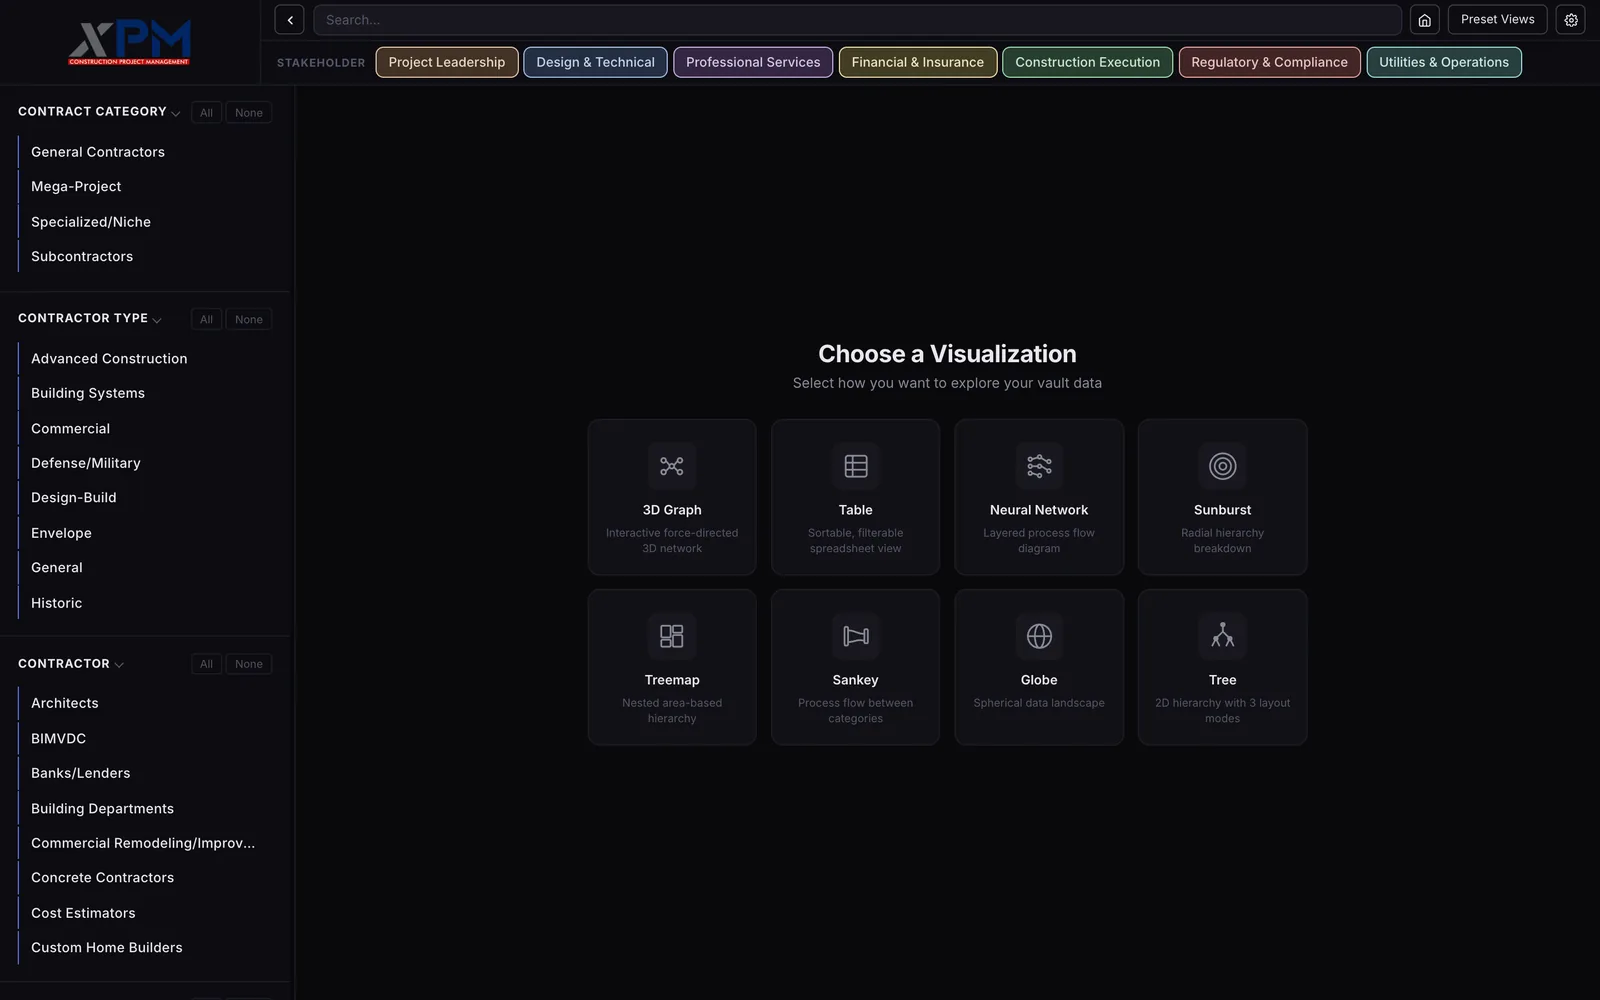
You sign in and land on a dashboard. The visualizations live on the Agent Map page, which loads the whole library and then asks which view you want.
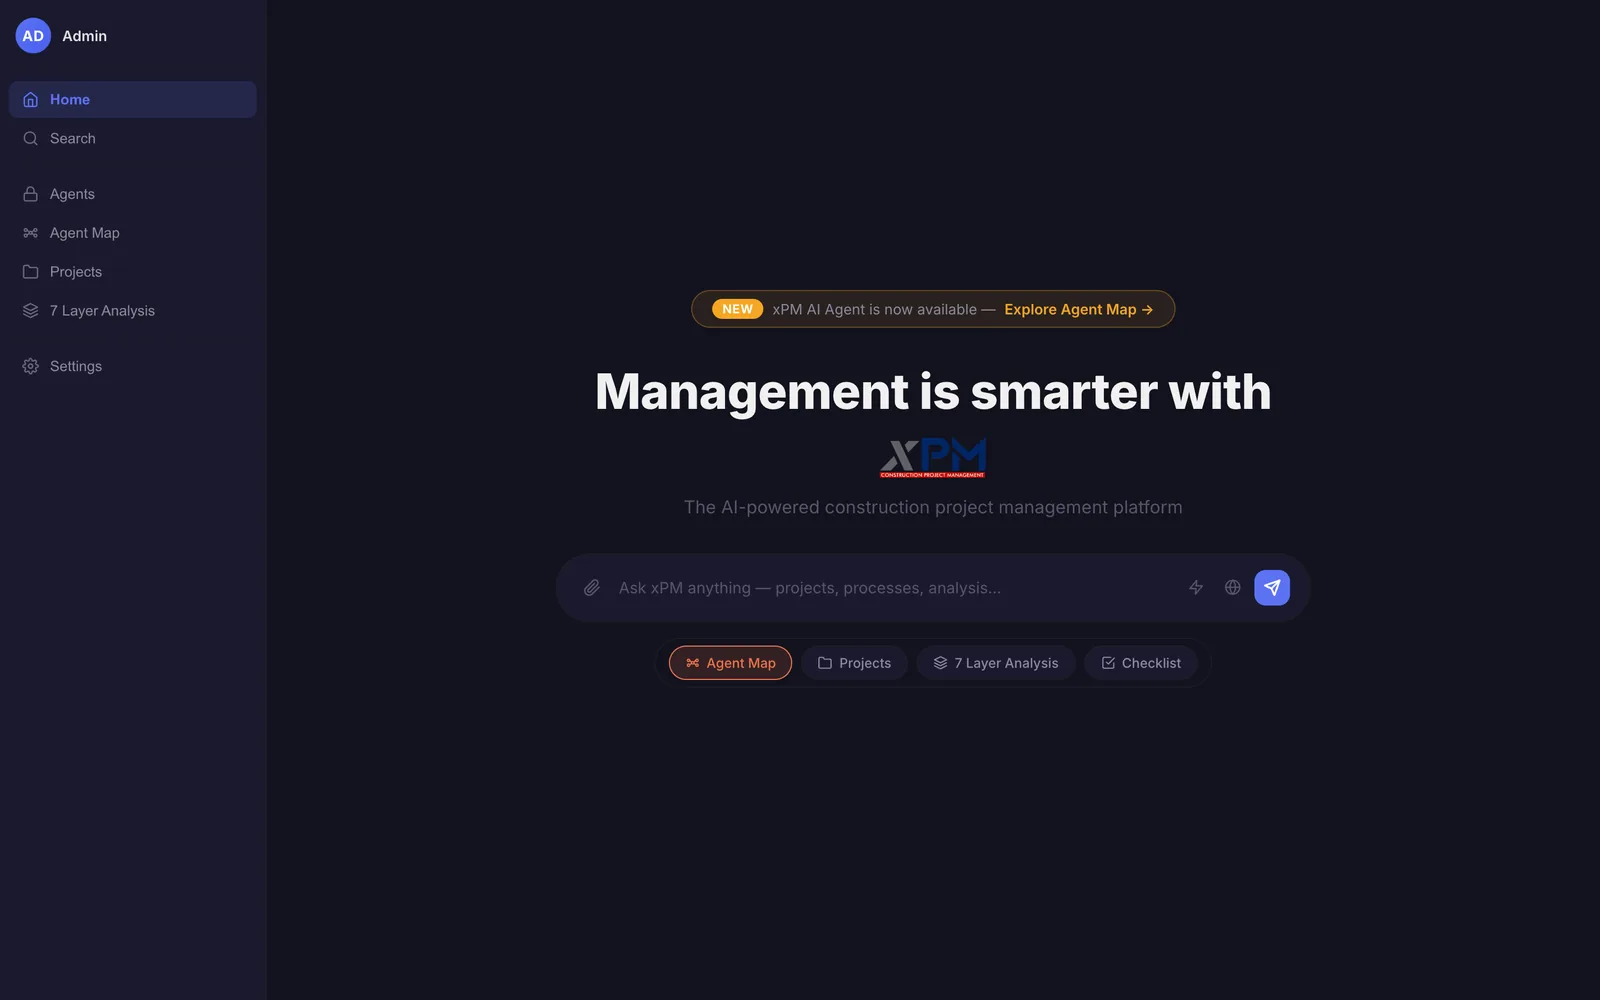
A dark dashboard with a left menu reading Home, Search, Agents, Agent Map, Projects, 7 Layer Analysis and Settings, and a centered heading reading Management is smarter with xPM above a chat box and four shortcut buttons
PL 02The dashboard you land on after signing in. Agent Map opens the visualizations, and the chat box isn't connected to anything yet.
The xPM Agent Map page with seven colored stakeholder chips along the top, a filter sidebar listing contract categories and contractor types, and eight cards in the middle titled 3D Graph, Table, Neural Network, Sunburst, Treemap, Sankey, Globe and Tree
PL 03The view picker after the library loads, with the stakeholder chips across the top and the filter sidebar on the left.

Sheet 03 of 09/Data

From spreadsheets to one file

It started as an Excel checklist with tabs for the general contractor, the designer and the owner. I turned it into an Obsidian vault first, with one markdown note per process and the stages color coded in Obsidian's graph view. Then I wrote a web app to draw the vault as a 3D graph.

Next I imported more spreadsheets and moved everything into a folder tree eight levels deep, from stakeholder group down to the single process. The final export is a master CSV plus 59 files split by contractor, each as a CSV and an Excel sheet. The app loads one 25 MB JSON file built from that CSV, with all 16,703 processes in it.

When I cloned the repo onto a Windows machine, some of the paths were too long to check out. I renamed every file and folder in the vault so each name stayed under 250 characters.

In the app, the table shows that file flat, grouped by stage, or folded into a hierarchy with a process count on every group.
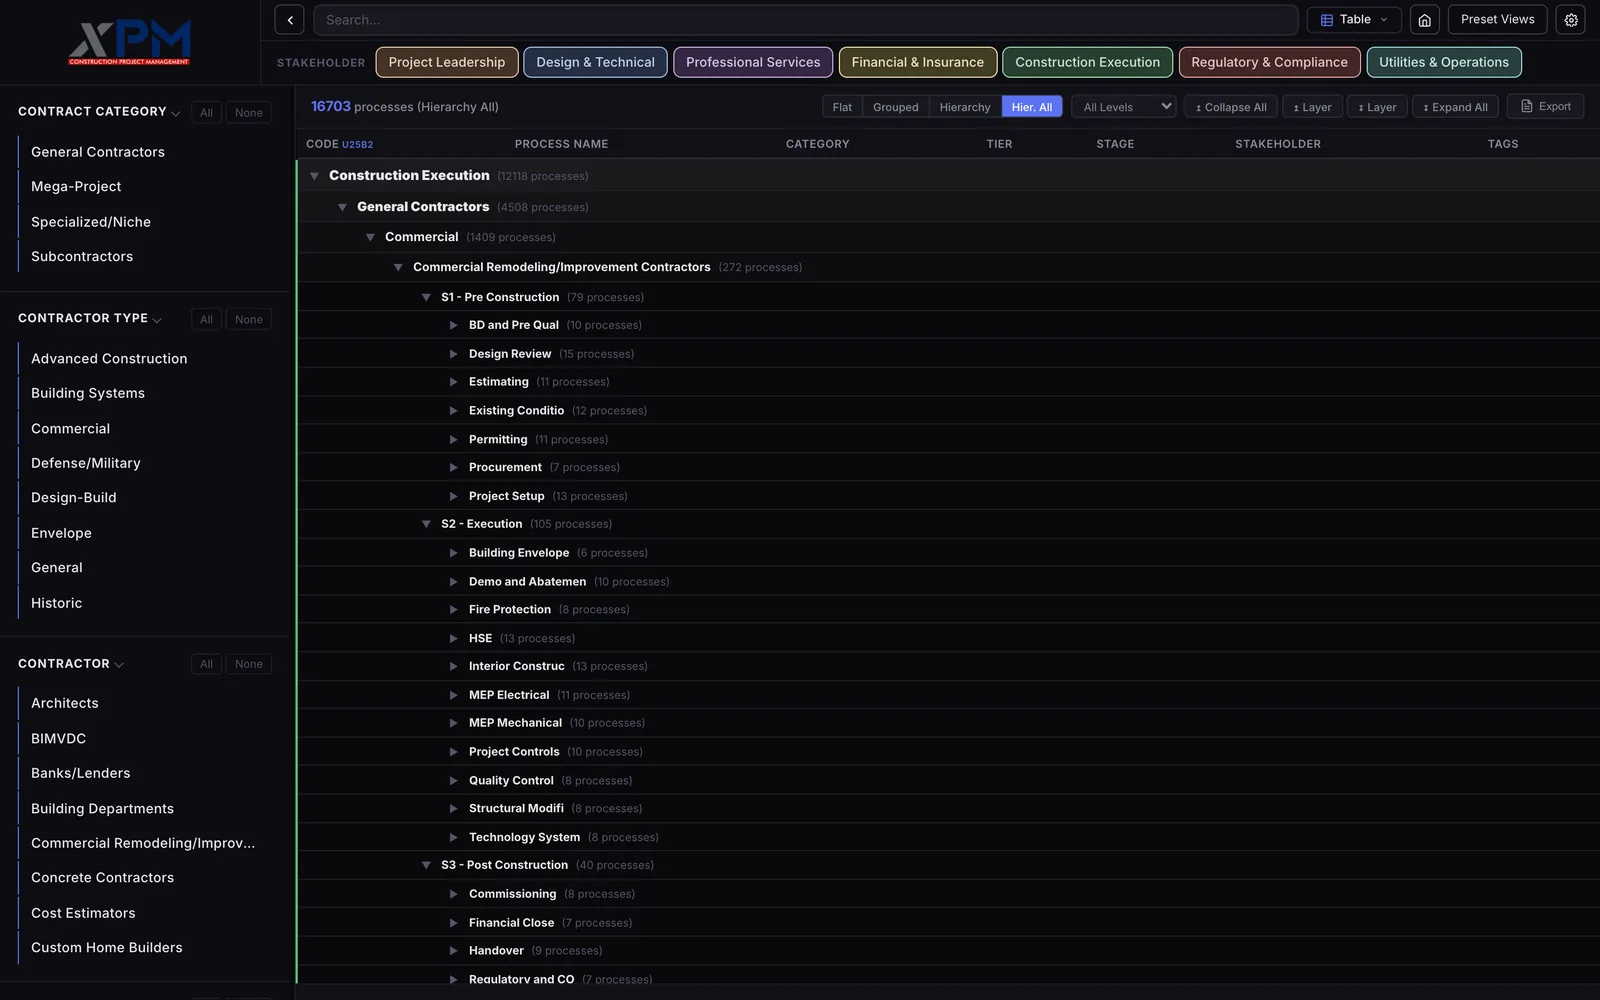
A dark table headed 16703 processes, showing nested rows from Construction Execution with 12118 processes down through General Contractors, Commercial, Commercial Remodeling Contractors and stage S1 to sub-stages like BD and Pre Qual and Design Review
PL 04The table in its hierarchy mode. Stakeholder, contract category, contractor type, contractor, stage and sub-stage fold inside each other, with a process count on every row.
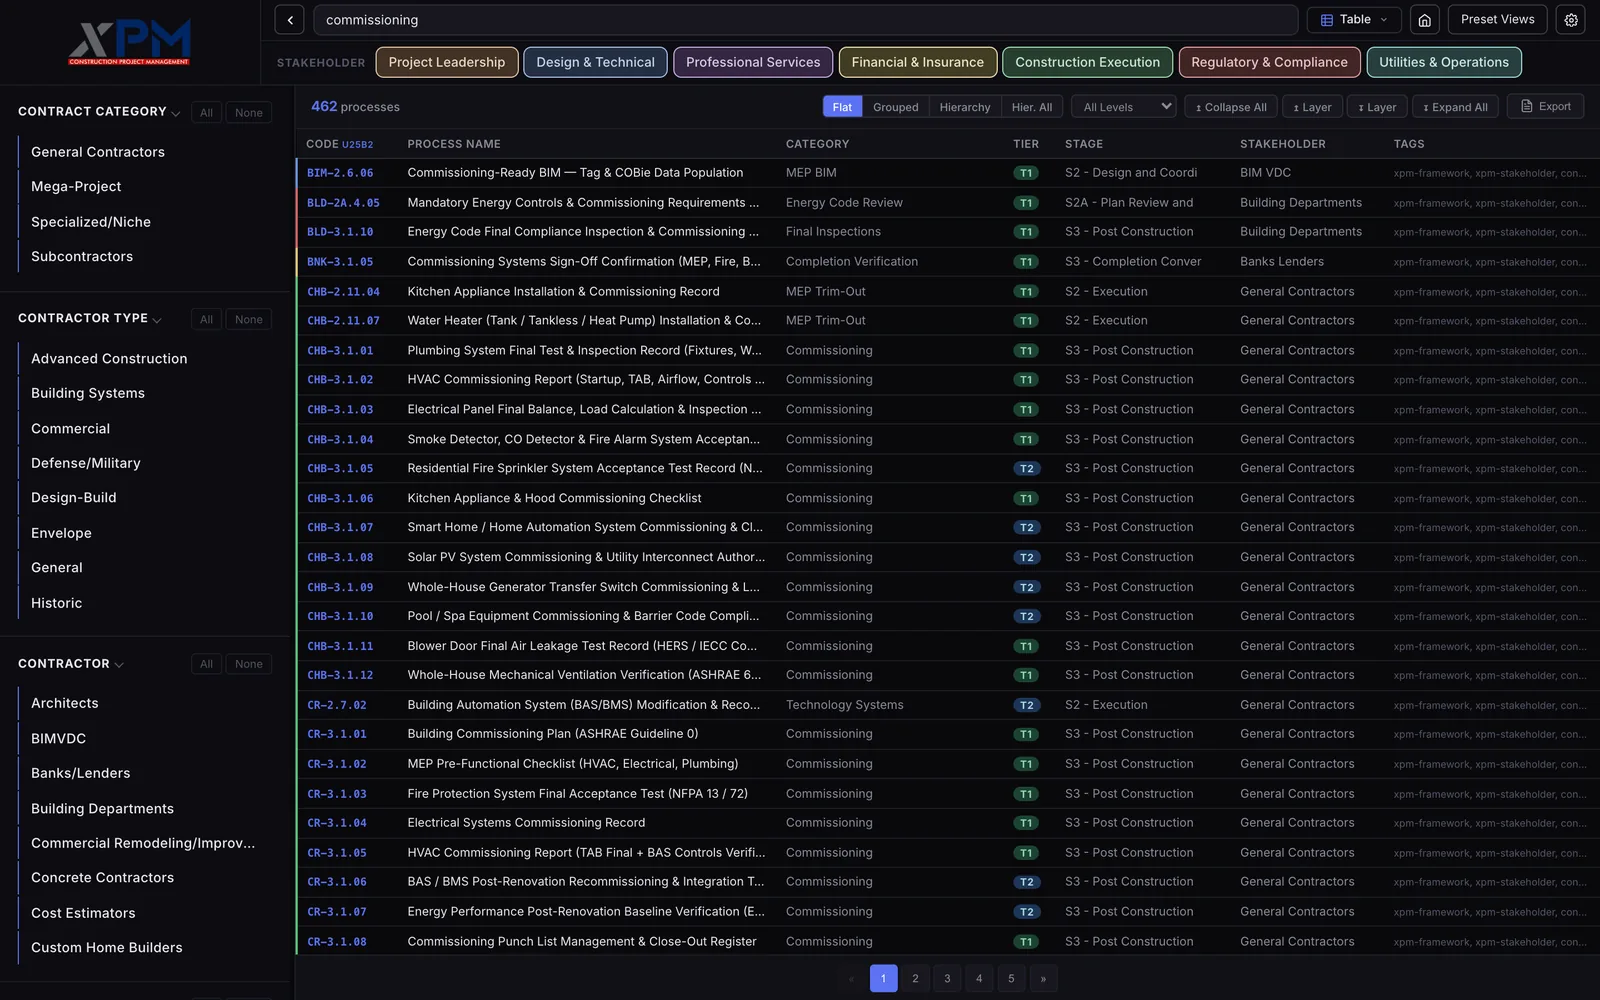
The same table in flat mode with commissioning typed into the search bar, a count of 462 processes, and rows of process codes like CHB-3.1.02 and CR-3.1.01 with titles about commissioning reports, green T1 and blue T2 tier badges and stage names
PL 05The search bar filters every view. Typing commissioning leaves 462 of the 16,703 processes in the flat table, each with its code, category, tier and stage.
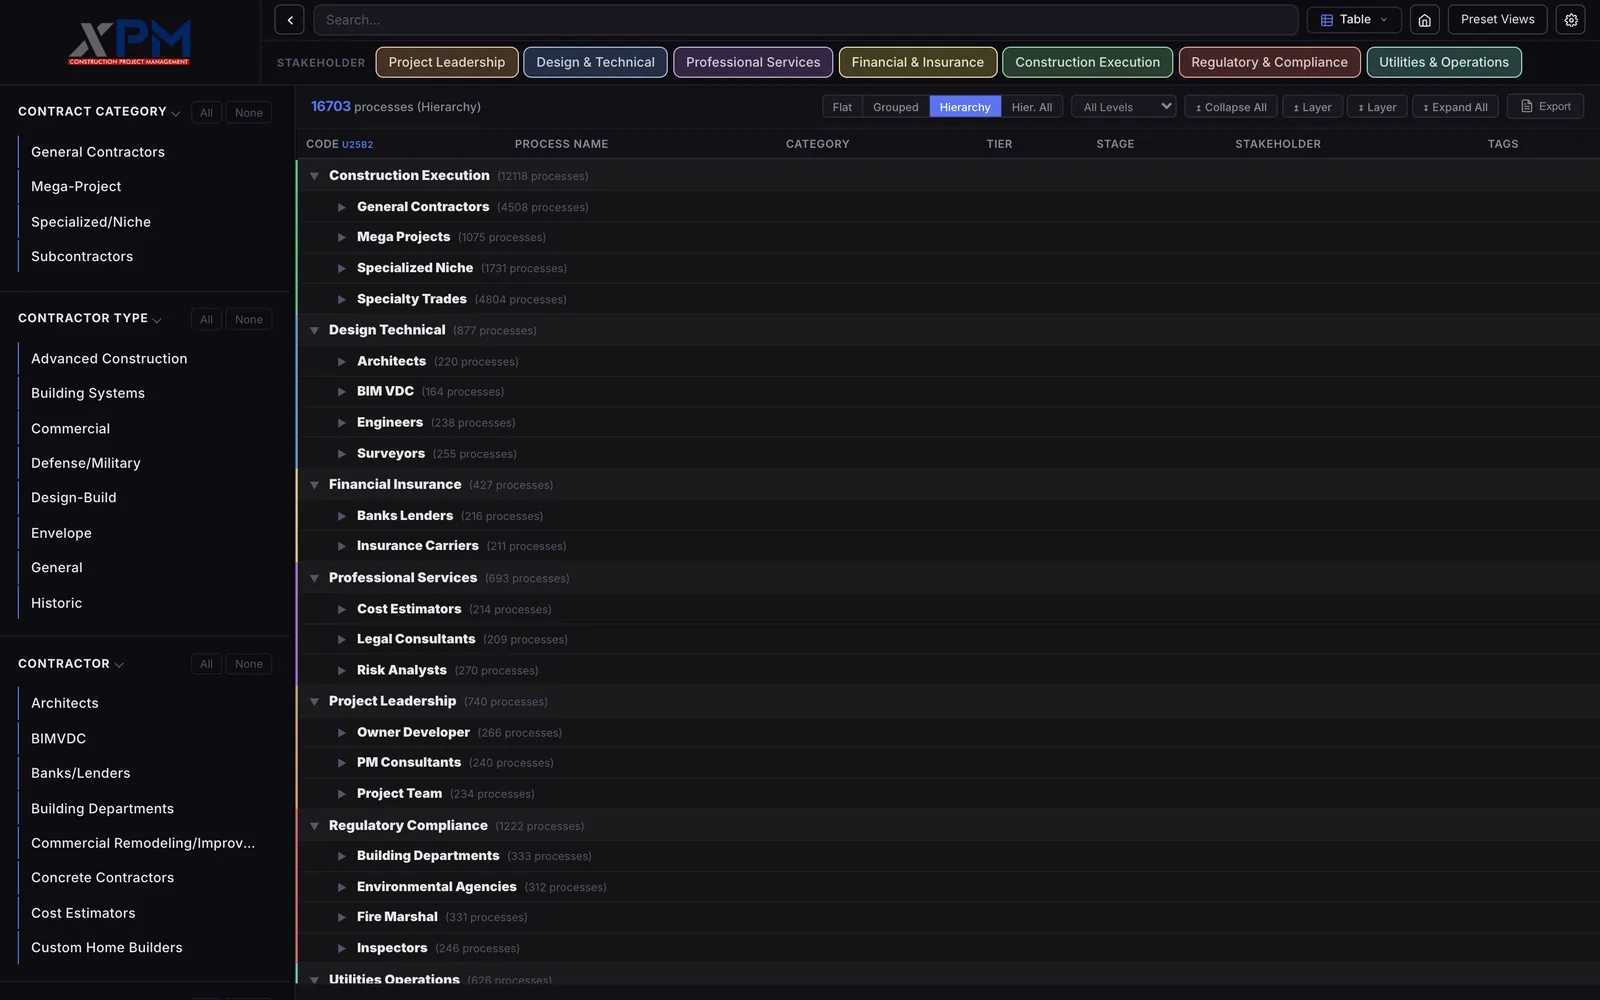
A dark table headed 16703 processes (Hierarchy), with folded rows for Construction Execution 12118, Design Technical 877, Financial Insurance 427, Professional Services 693, Project Leadership 740 and Regulatory Compliance 1222, each opened one level to rows like General Contractors 4508 and Specialty Trades 4804
PL 20The table in Hierarchy mode, closed down to two levels so every stakeholder group and contract category shows its process count. Construction Execution holds 12,118 of them.
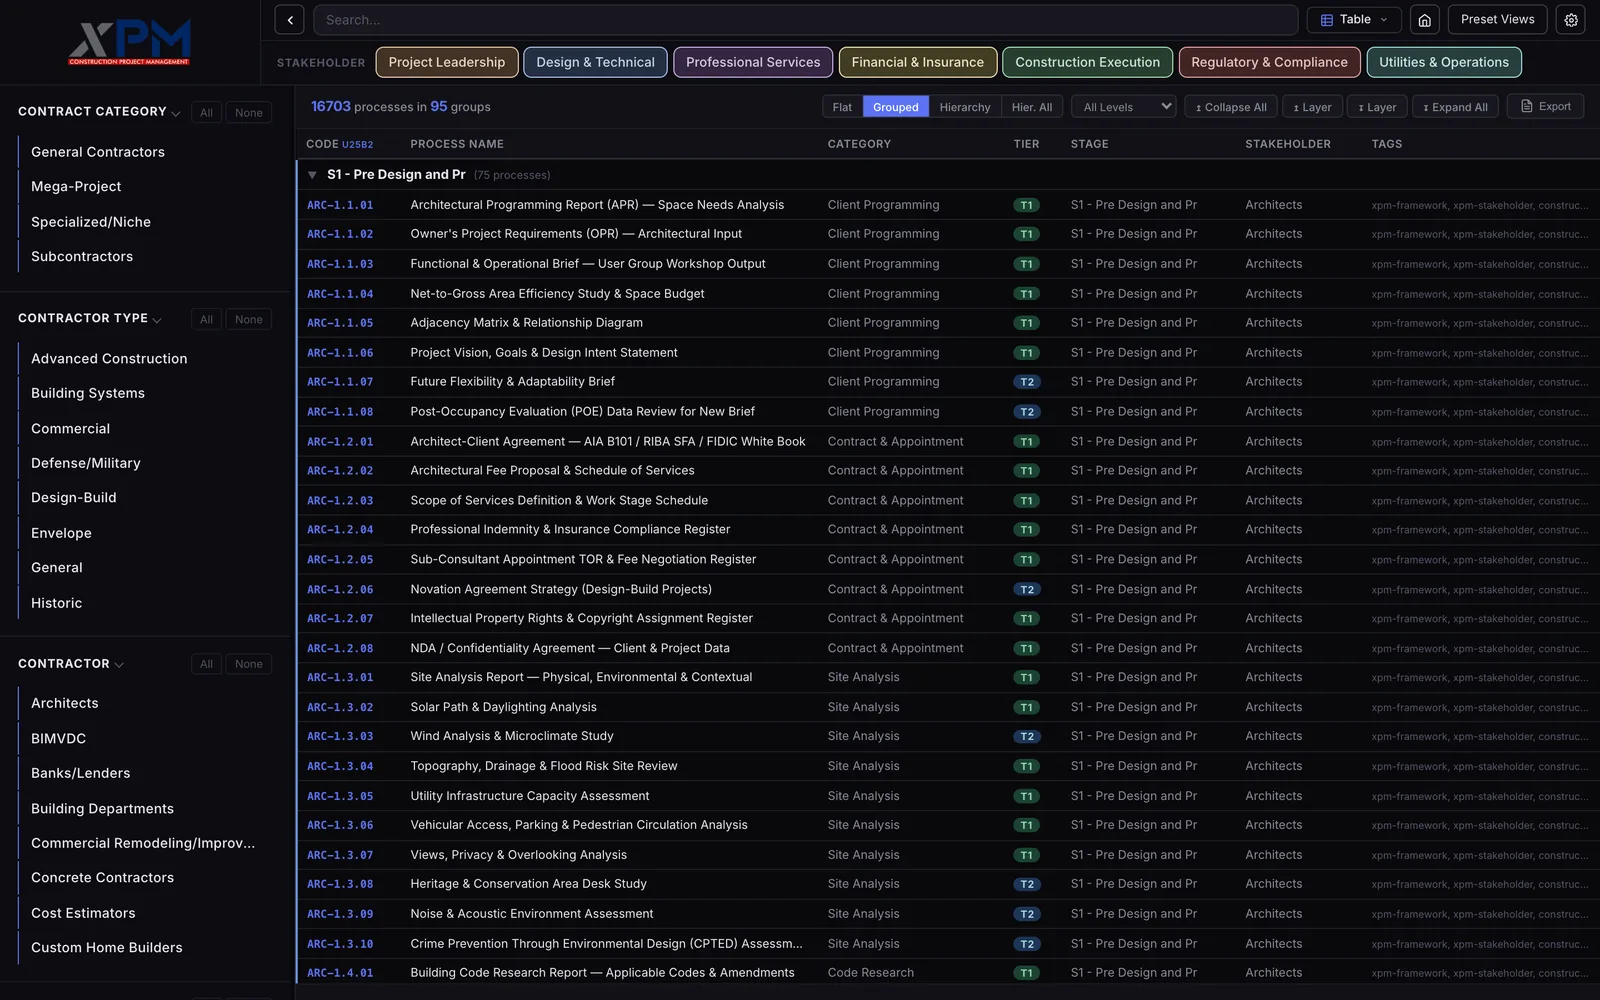
A dark table headed 16703 processes in 95 groups, with a group row for S1 Pre Design and Pr holding 75 processes, then architect process codes from ARC-1.1.01 to ARC-1.4.01 with names like Architectural Programming Report, green T1 and blue T2 badges and a stakeholder column reading Architects
PL 21Grouped mode sorts the same 16,703 processes into 95 groups by stage, and each group folds open to its rows.

Sheet 04 of 09/Views

Eight ways to see the same library

The picker has eight views. There's the 3D graph, a table, a layered network, a sunburst, a treemap, a Sankey diagram, a globe and a 2D tree. They all read the same filters, so a stakeholder chip or a stage picked in the sidebar narrows whichever view is open. There's a light theme as well as the dark one.

The sunburst, the treemap and the tree start near the top of the hierarchy and open further when you click. A slice zooms the sunburst into that group, a box drills the treemap down with a breadcrumb to climb back up, and the tree has buttons to open or close one level at a time.
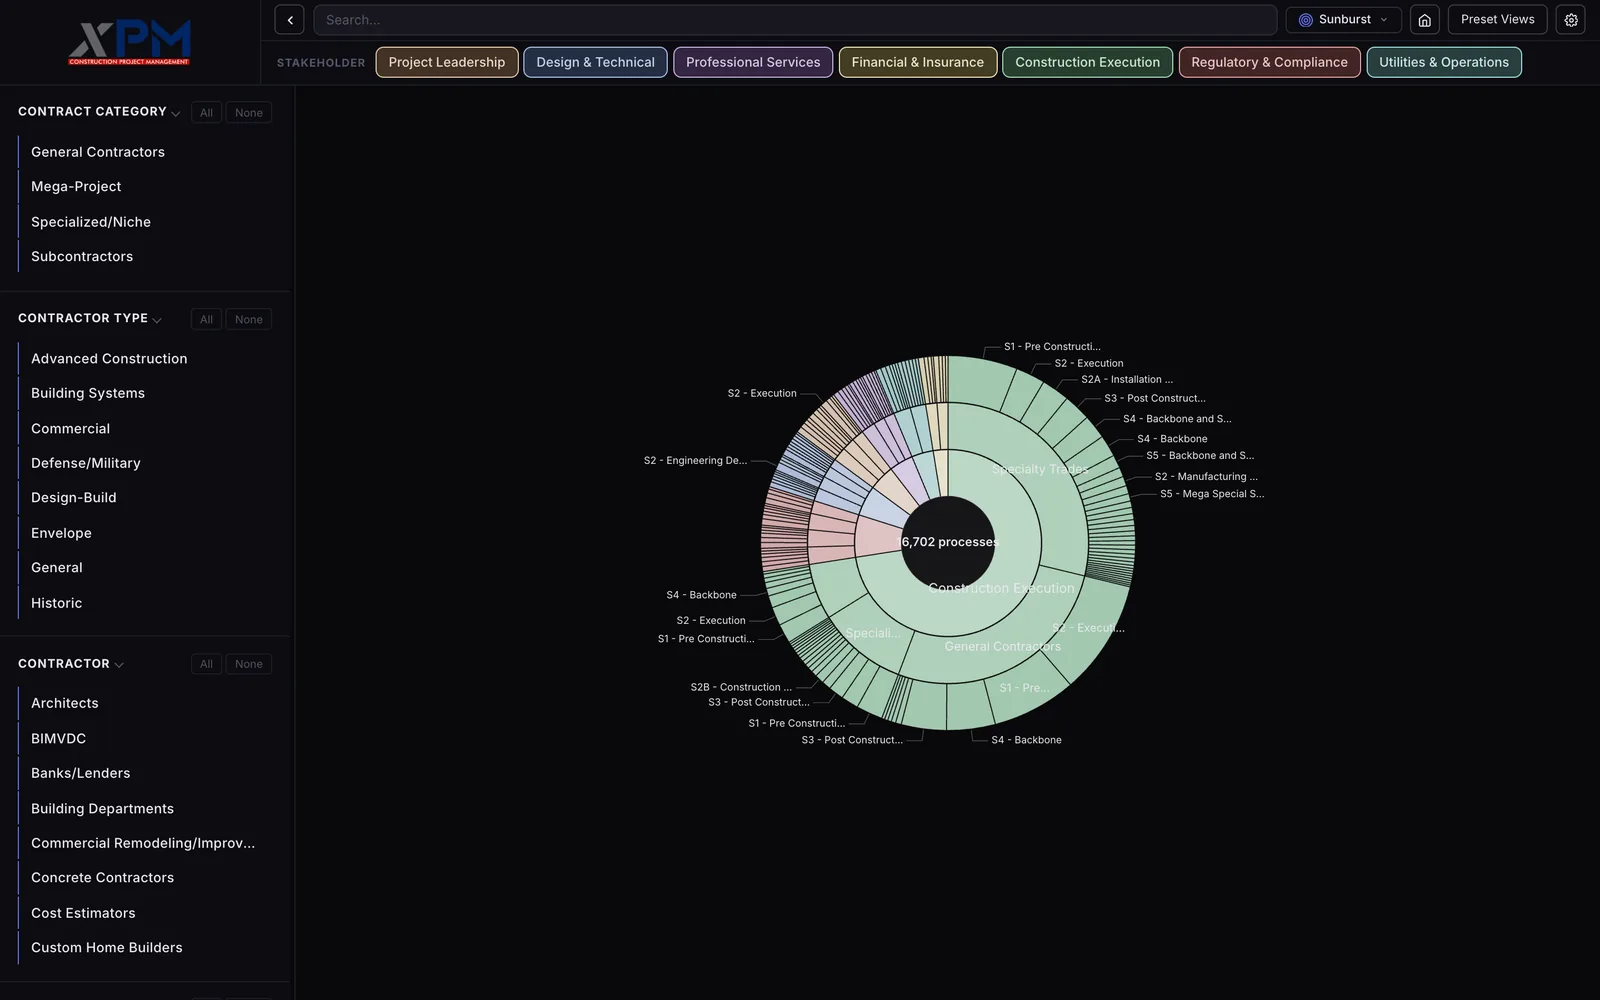
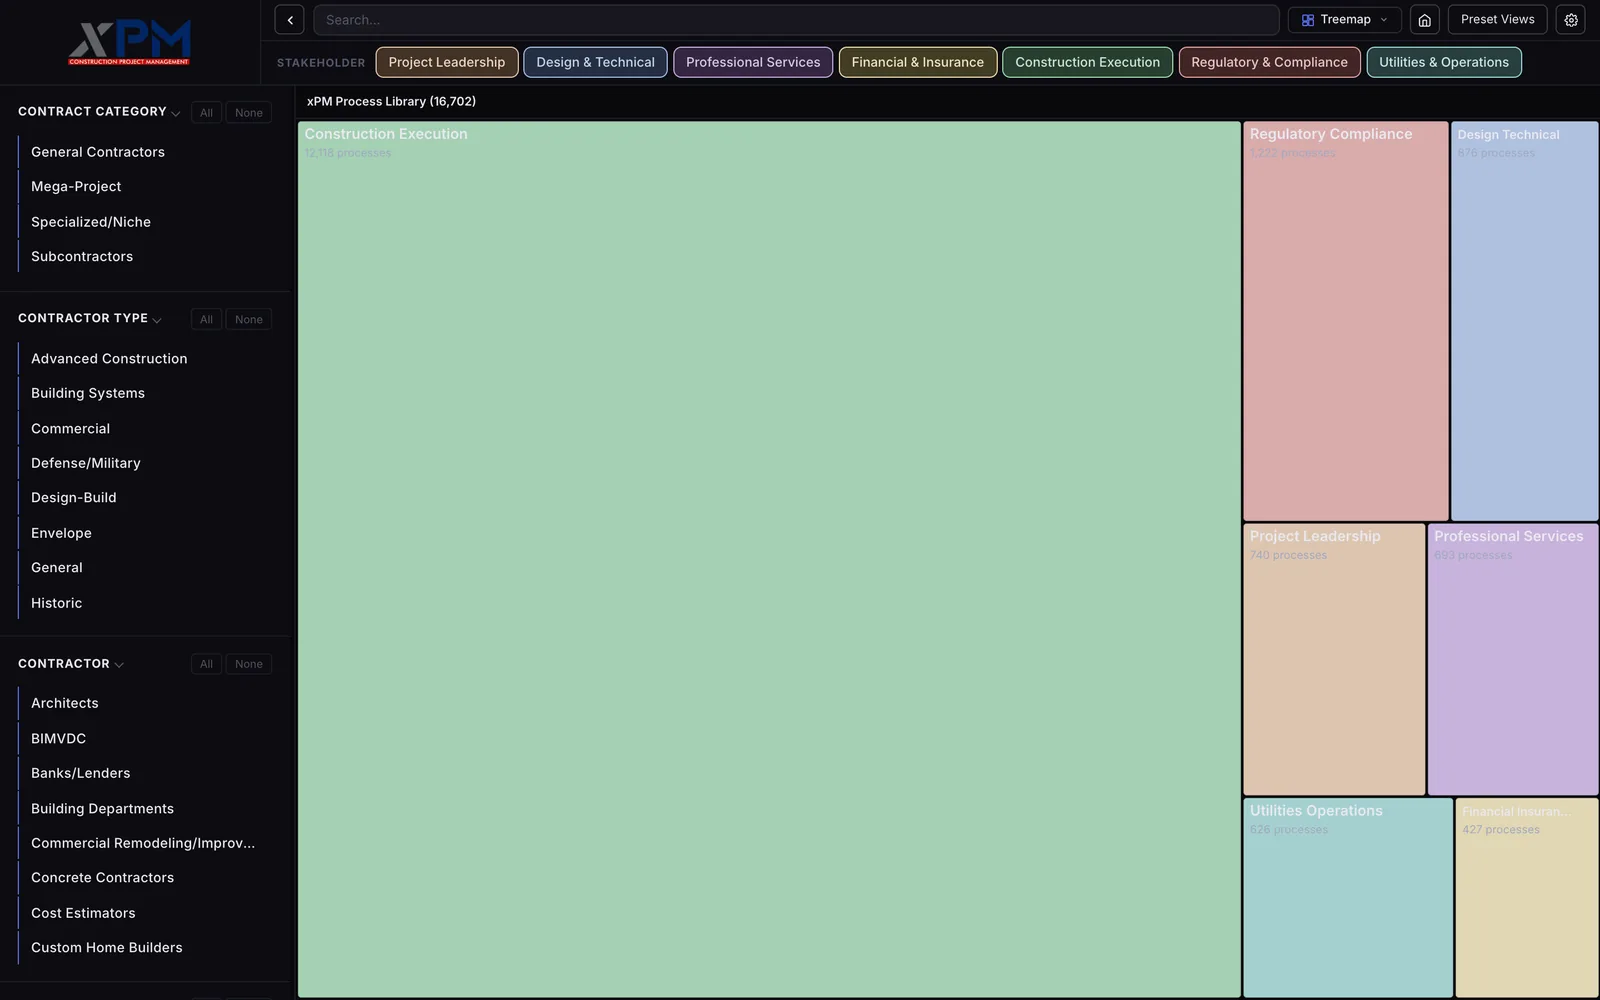
A pastel radial chart in the middle of the dark page, mostly green for Construction Execution with smaller pink, blue, purple and beige slices, and stage labels like S1 Pre Construction and S4 Backbone around the edge
PL 06The sunburst, with stakeholder groups in the inner ring and contract categories and stages outside them. Clicking a slice zooms into it.
A treemap filling the page with a large green box labeled Construction Execution and smaller boxes for Regulatory Compliance, Design Technical, Project Leadership, Professional Services, Utilities Operations and Financial Insurance
PL 07The treemap, where each box is sized by process count. Construction Execution alone holds 12,118 of the processes.
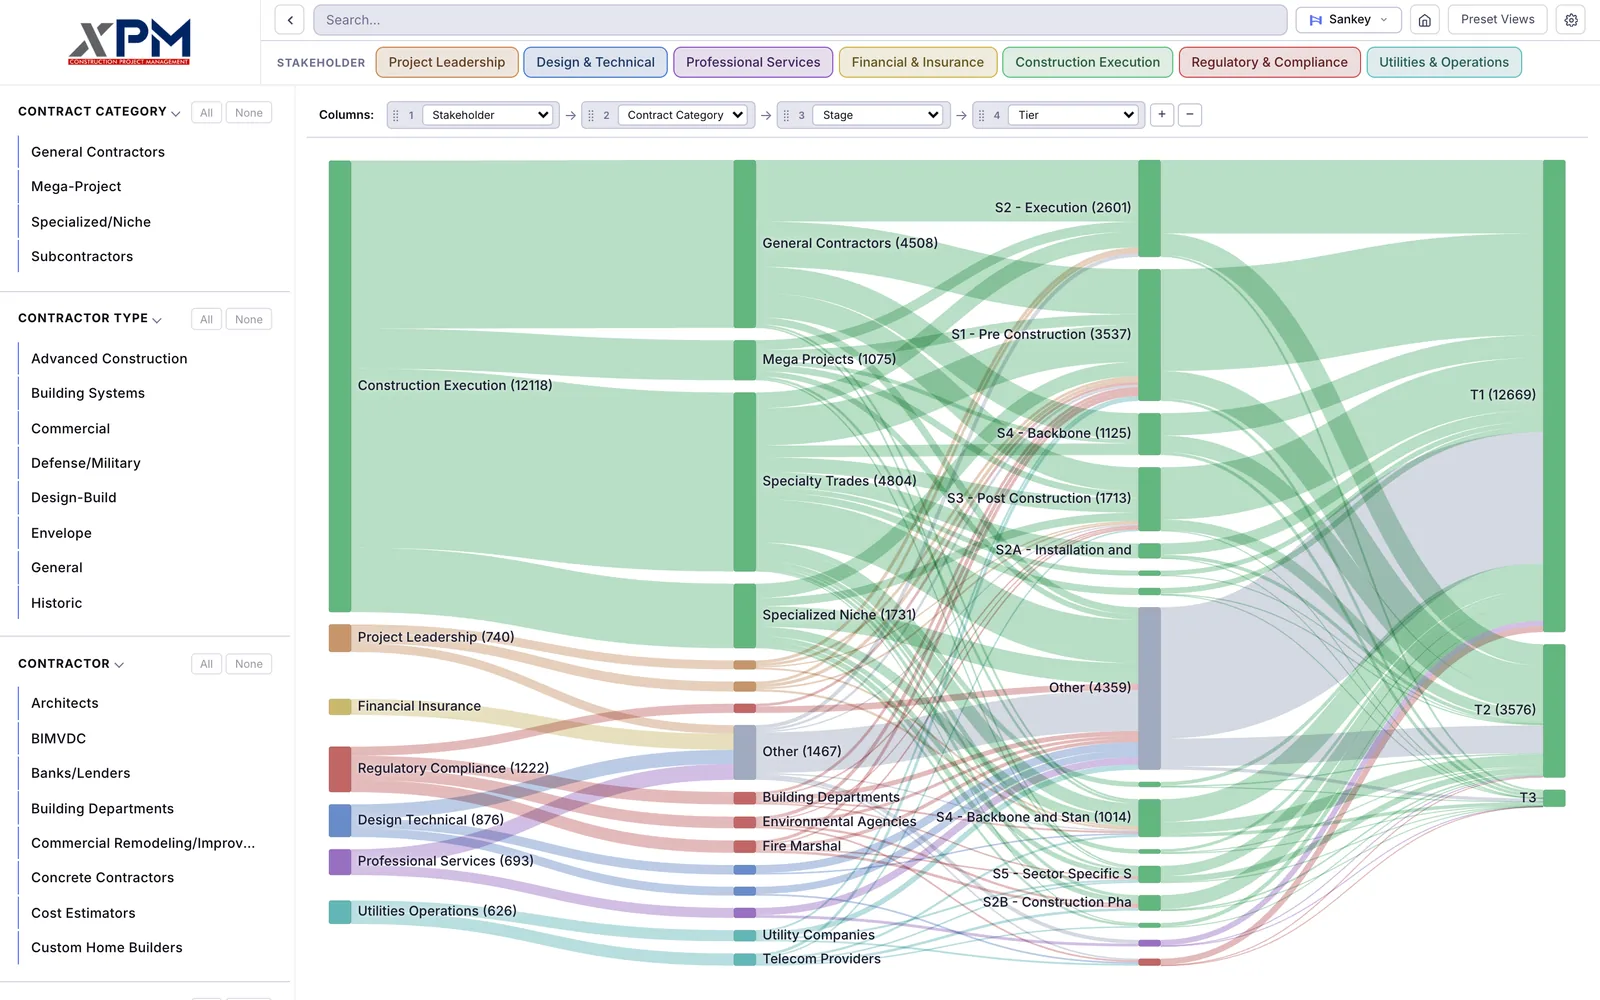
A light themed flow diagram with four columns of colored bars joined by wide translucent bands, from Construction Execution 12118 on the left through General Contractors and Specialty Trades and stages like S2 Execution to tiers T1 12669 and T2 3576 on the right
PL 08The Sankey diagram in the light theme, running from stakeholder to contract category to stage to tier. You can pick two to six columns from ten fields.
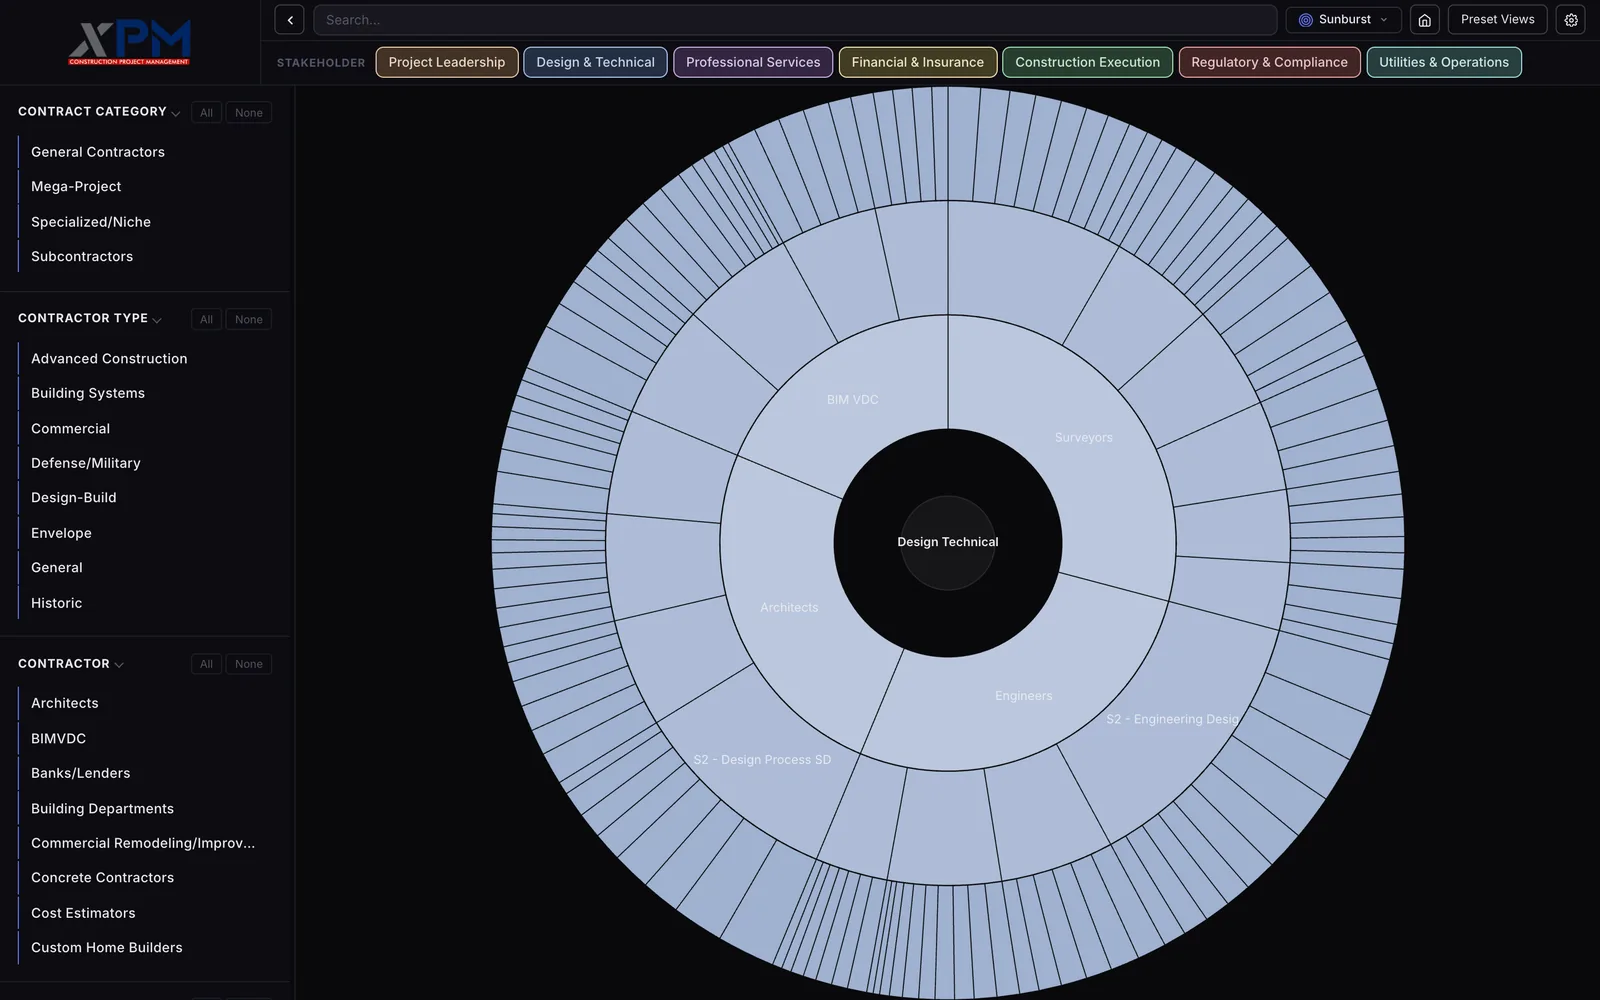
A pale blue sunburst filling the page with Design Technical in the dark center, a ring split into BIM VDC, Surveyors, Engineers and Architects, and two outer rings of narrower slices with labels like S2 Design Process SD
PL 22Clicking a slice zooms the sunburst into it. Here it's Design Technical, with Architects, BIM VDC, Engineers and Surveyors in the first ring and their stages and sub-stages outside.
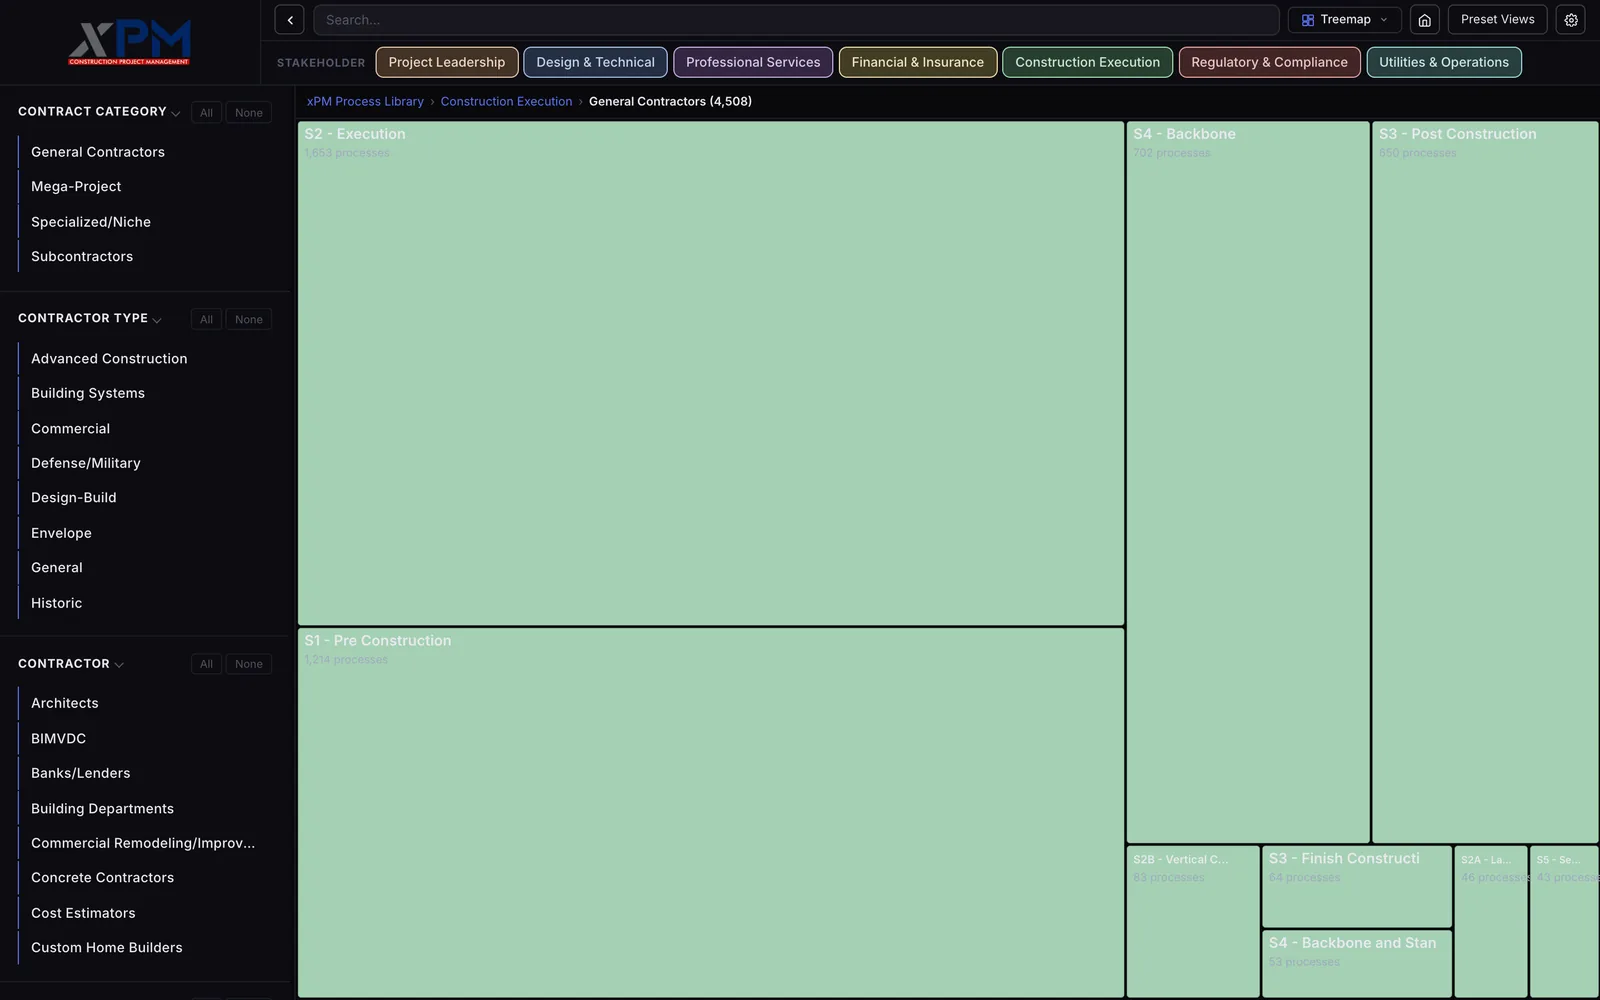
A green treemap under a breadcrumb reading xPM Process Library, Construction Execution, General Contractors (4,508), with large boxes for S2 Execution 1,653 processes and S1 Pre Construction 1,214 and smaller ones for S4 Backbone, S3 Post Construction and S3 Finish Construction
PL 23The treemap drilled down twice, into Construction Execution and then General Contractors. Its 4,508 processes split by stage, and the breadcrumb at the top climbs back up.
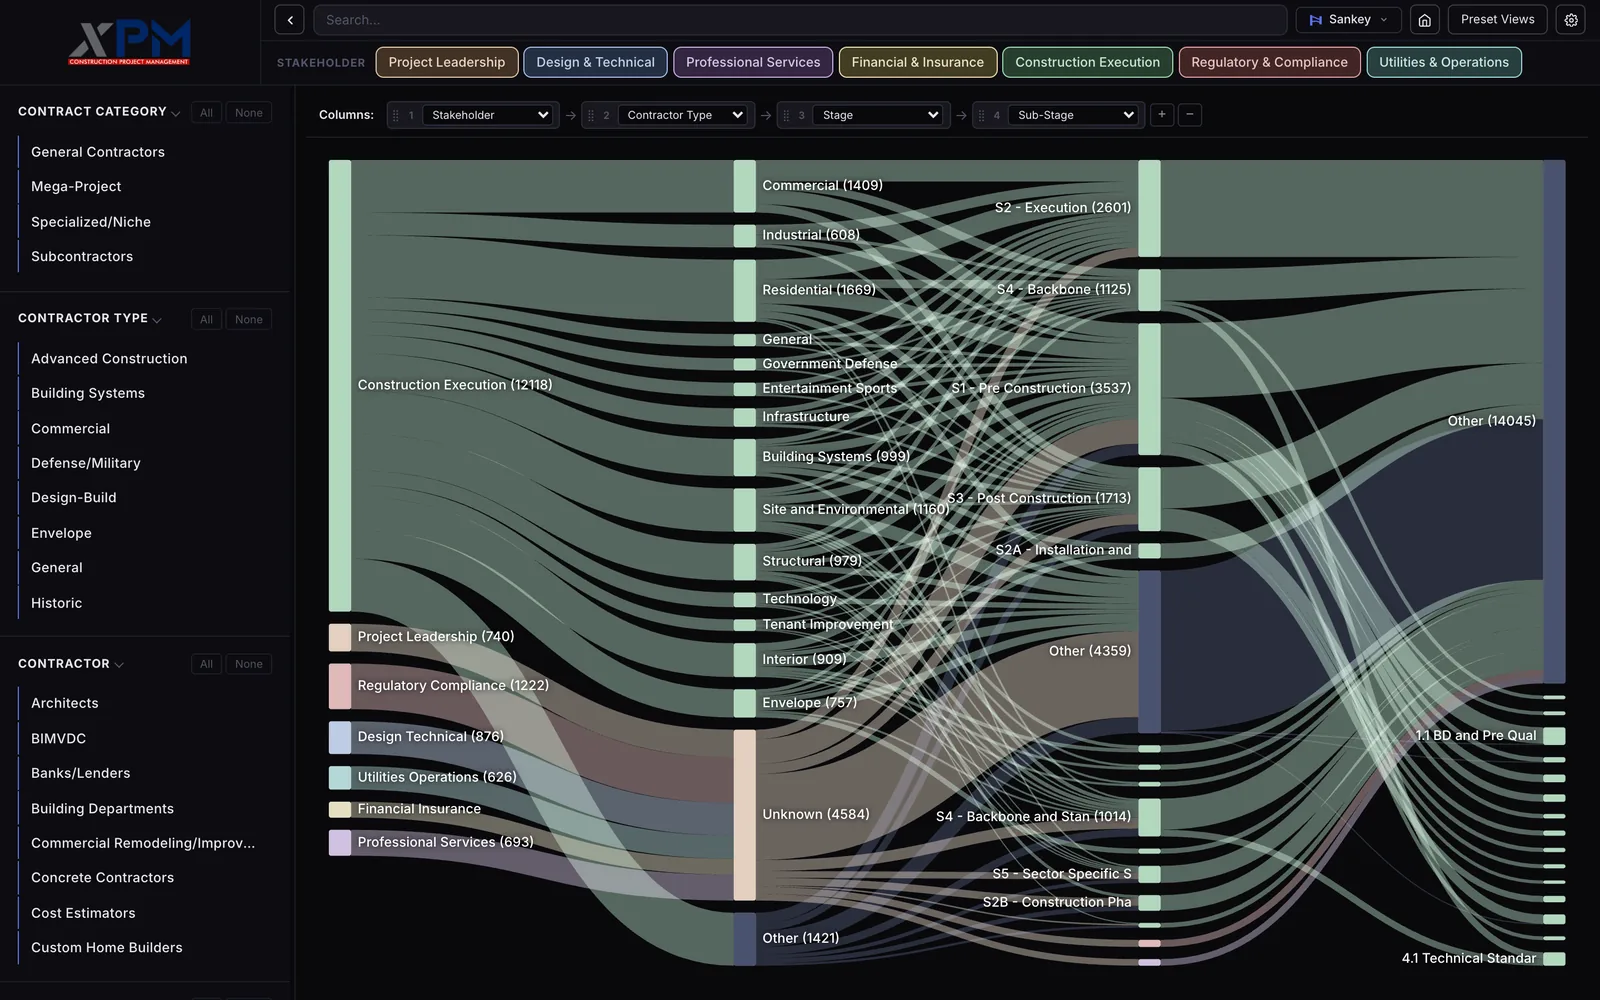
A dark flow diagram under a Columns bar reading Stakeholder, Contractor Type, Stage and Sub-Stage with plus and minus buttons, and colored bands running from Construction Execution 12118 through contractor types like Commercial, Residential and Unknown to stages and sub-stages
PL 24The Sankey in the dark theme with two of its columns changed, so it runs from stakeholder to contractor type, stage and sub-stage. Each column is a menu, and the plus and minus buttons add or drop one.
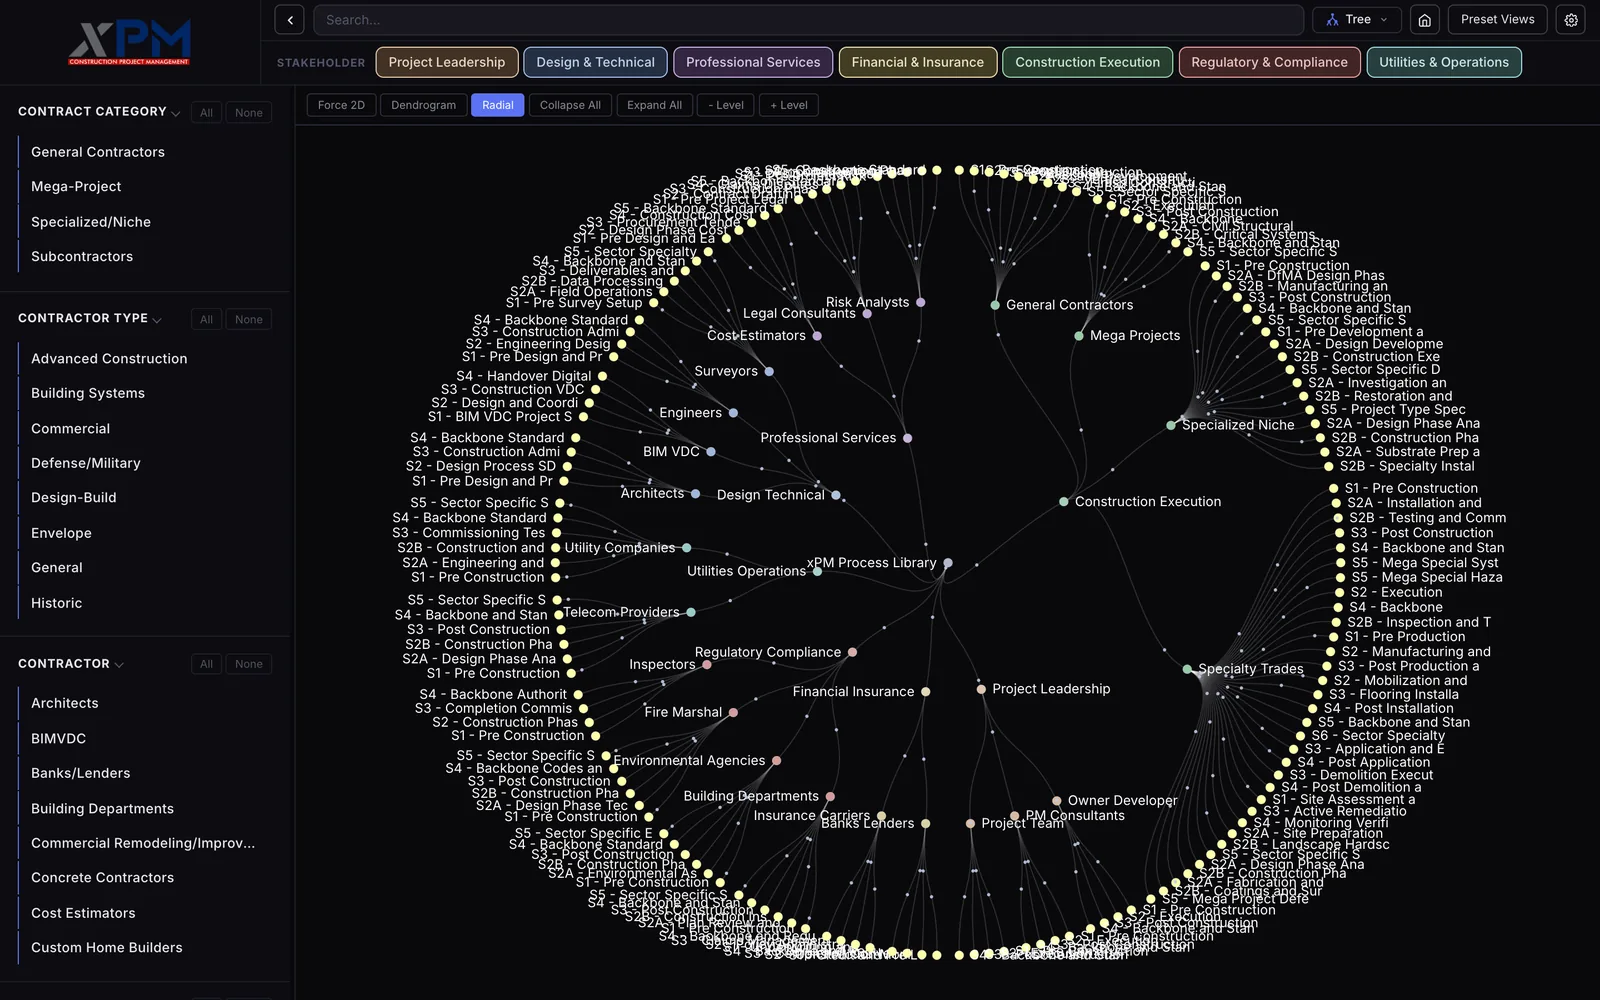
A radial tree on a dark background branching from a center node labeled xPM Process Library out to stakeholder and contractor nodes, with a ring of yellow stage nodes and crowded labels around the outside
PL 10The 2D tree in its radial layout, with xPM Process Library at the center and stage nodes around the rim. It also has a dendrogram and a flat force layout.
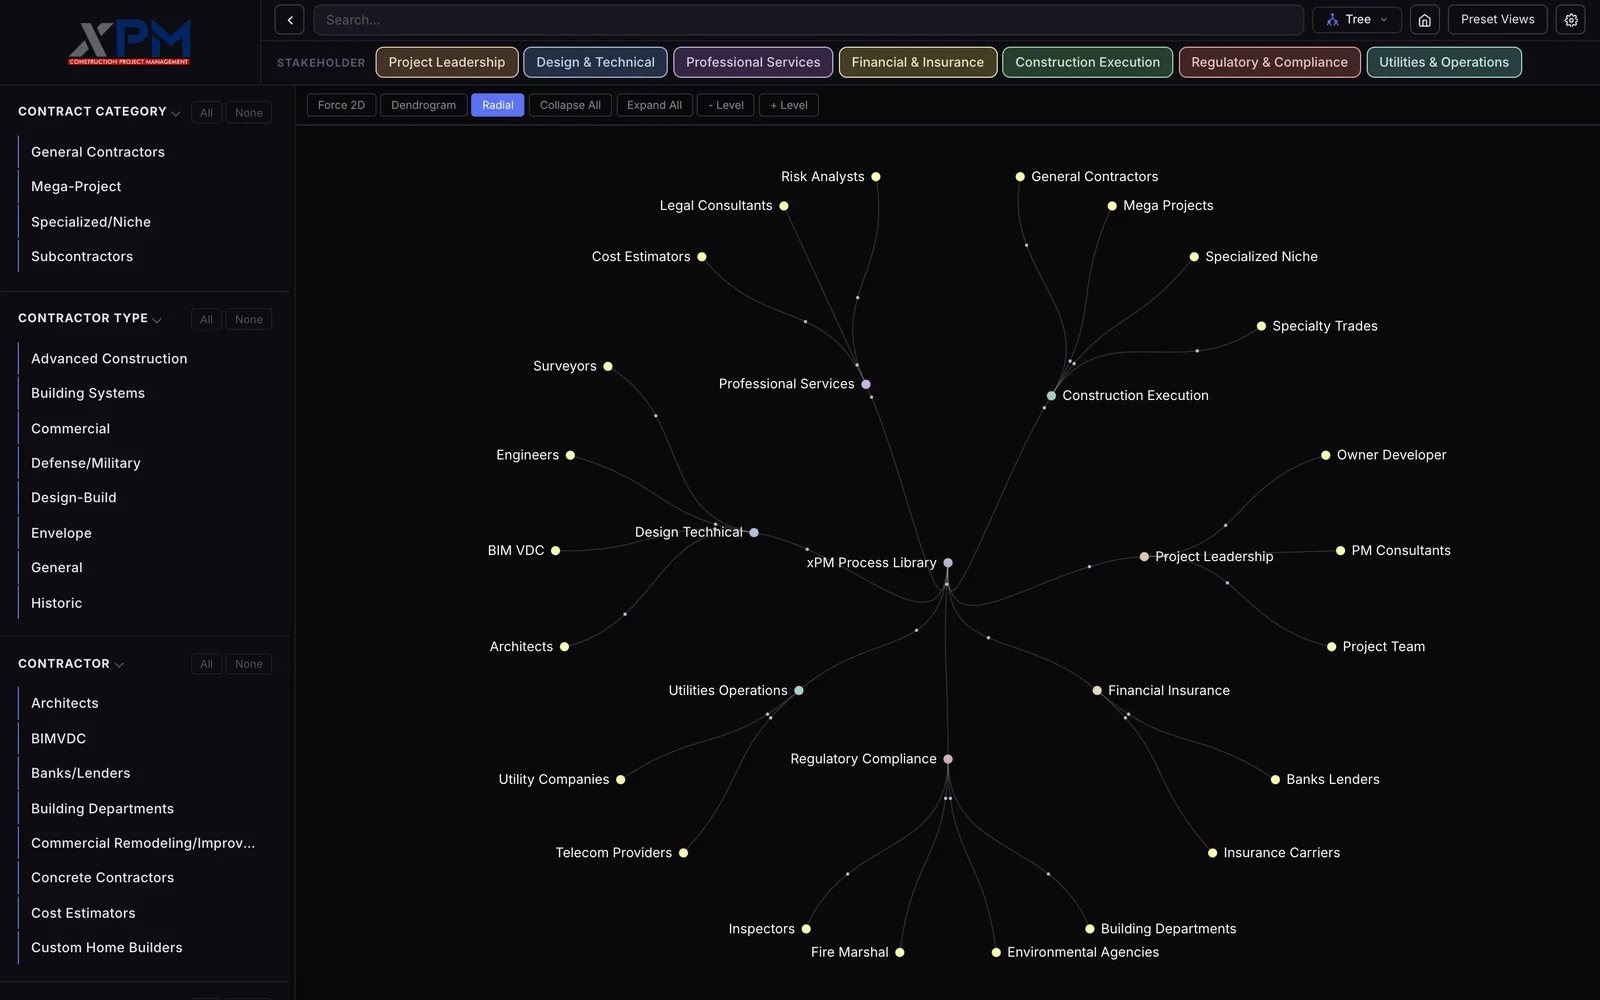
A radial tree on a dark background with xPM Process Library in the middle, seven stakeholder nodes such as Construction Execution and Regulatory Compliance around it, and yellow leaf nodes like General Contractors, Fire Marshal and Telecom Providers, under a bar of Force 2D, Dendrogram, Radial, Collapse All, Expand All and Level buttons
PL 25The radial tree folded back to two levels, the seven stakeholder groups and the contract categories under them. The Level buttons open or close one ring at a time.
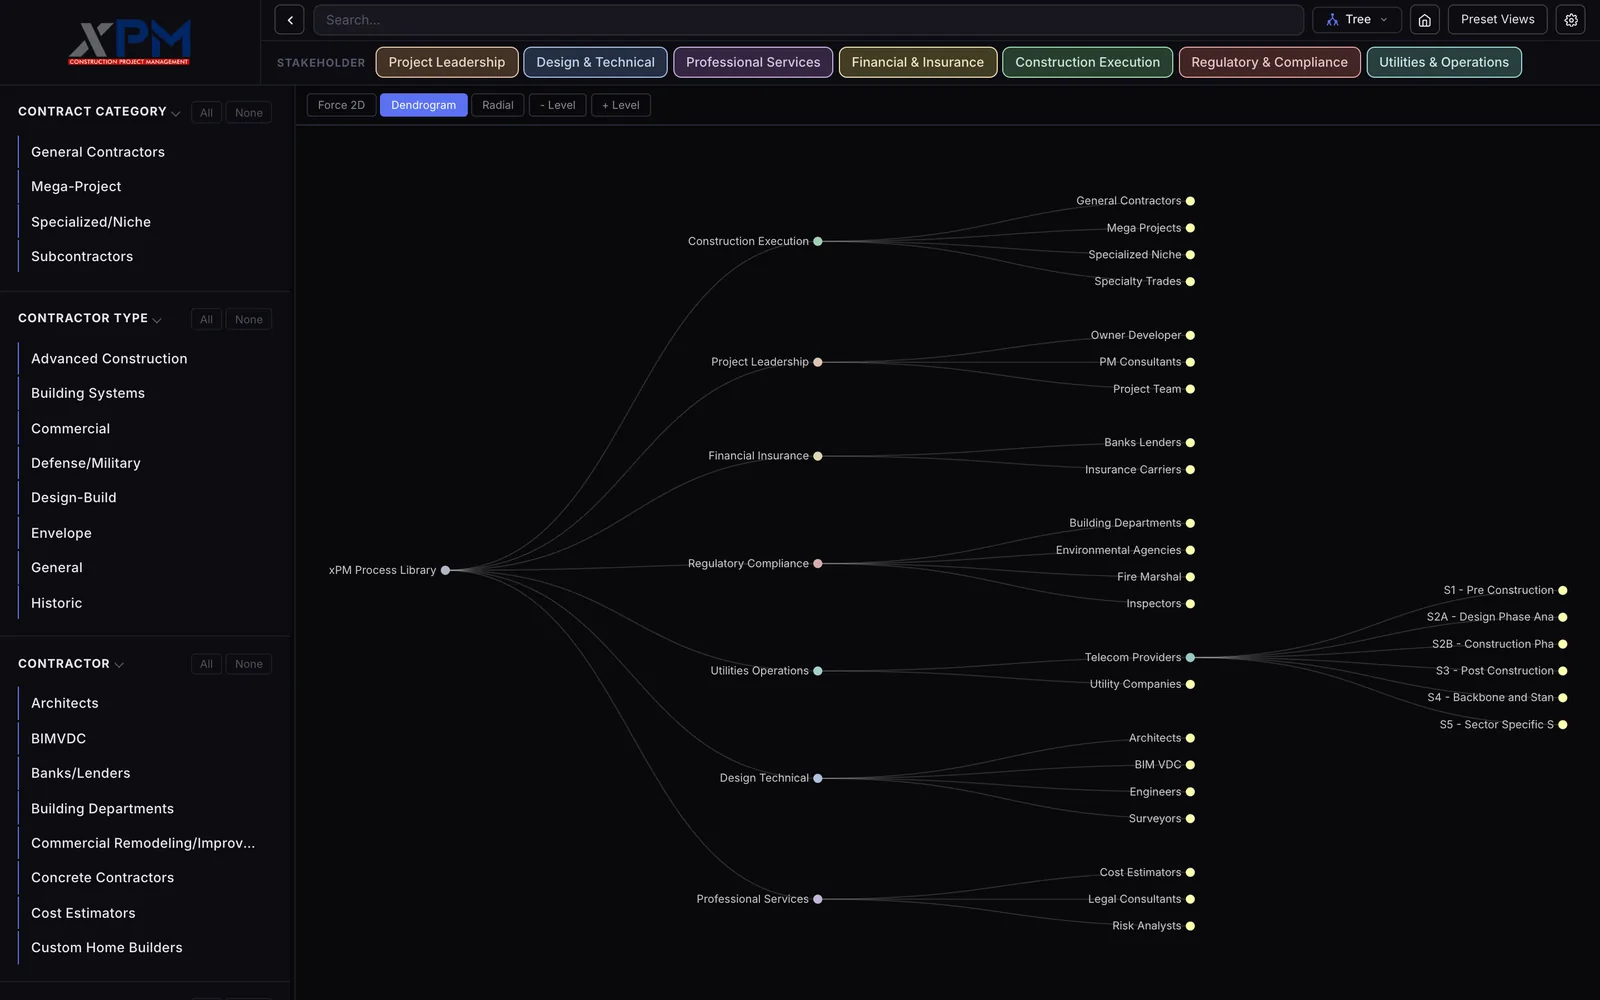
A left to right tree on a dark background from xPM Process Library to the seven stakeholder groups and their categories, with one branch, Telecom Providers under Utilities Operations, fanning out to six stage nodes from S1 Pre Construction to S5 Sector Specific
PL 26The same tree in its dendrogram layout, open to the contract categories, with only Telecom Providers opened further to its six stages. Clicking a node opens or closes it.
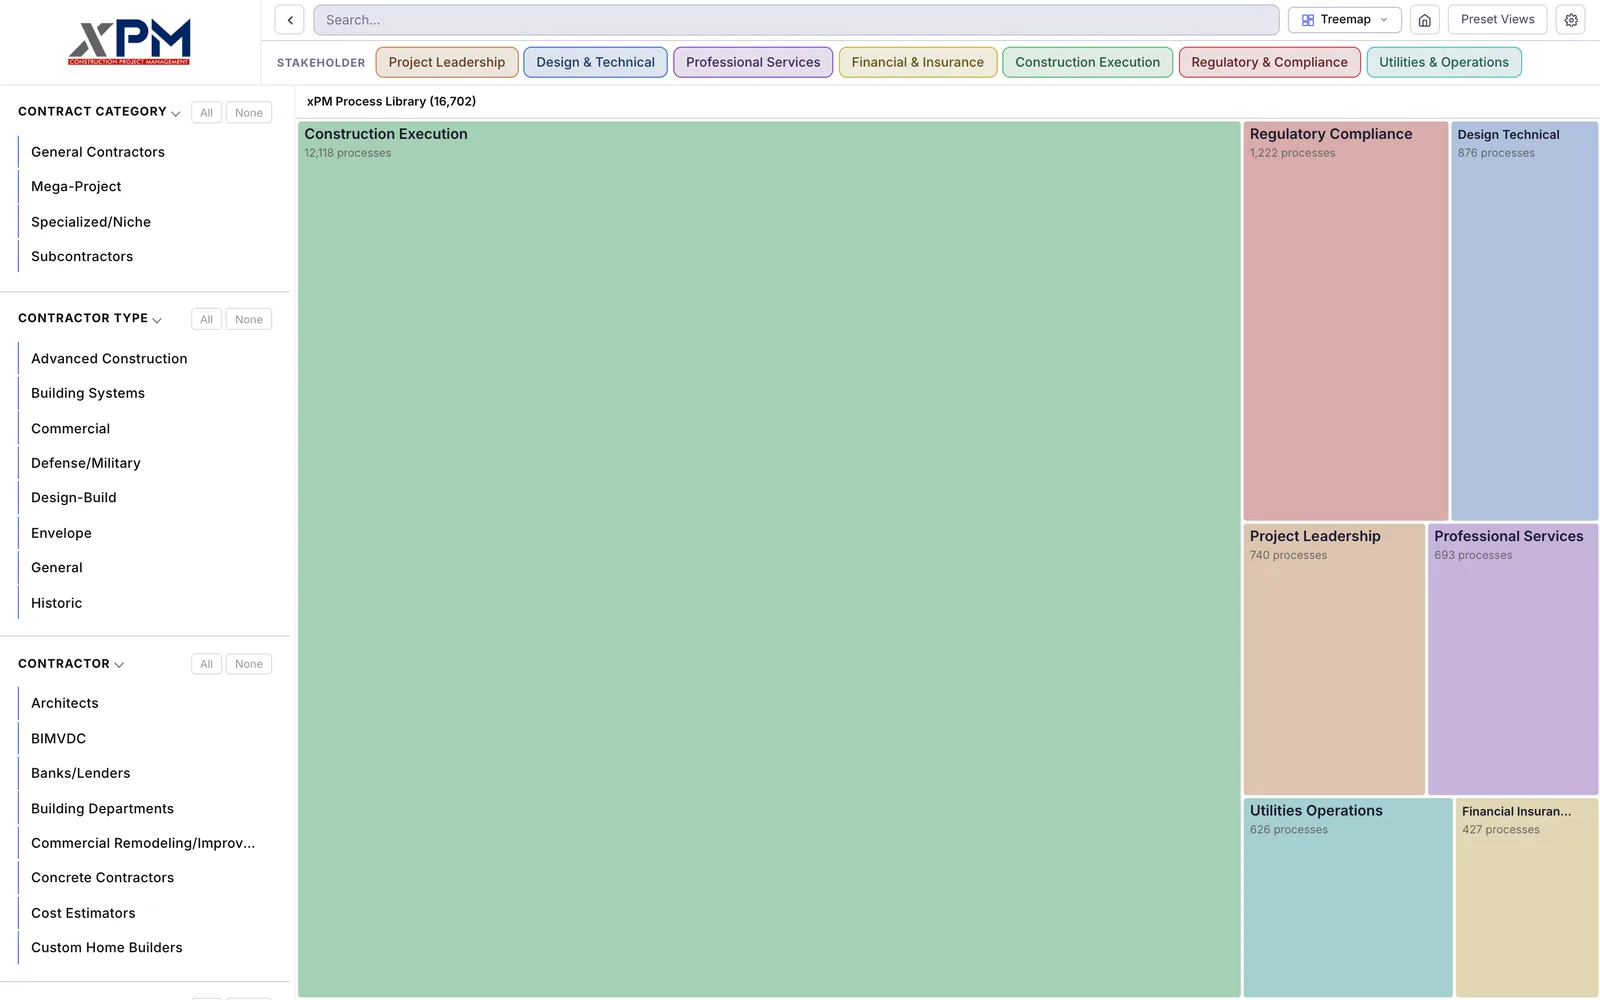
A light page with a treemap of seven pastel boxes, a large green one for Construction Execution with 12,118 processes and smaller pink, blue, beige, purple, teal and yellow boxes for Regulatory Compliance, Design Technical, Project Leadership, Professional Services, Utilities Operations and Financial Insurance
PL 27The treemap in the light theme. Every stakeholder group gets a box sized by its process count, from 12,118 for Construction Execution down to 427 for Financial Insurance.
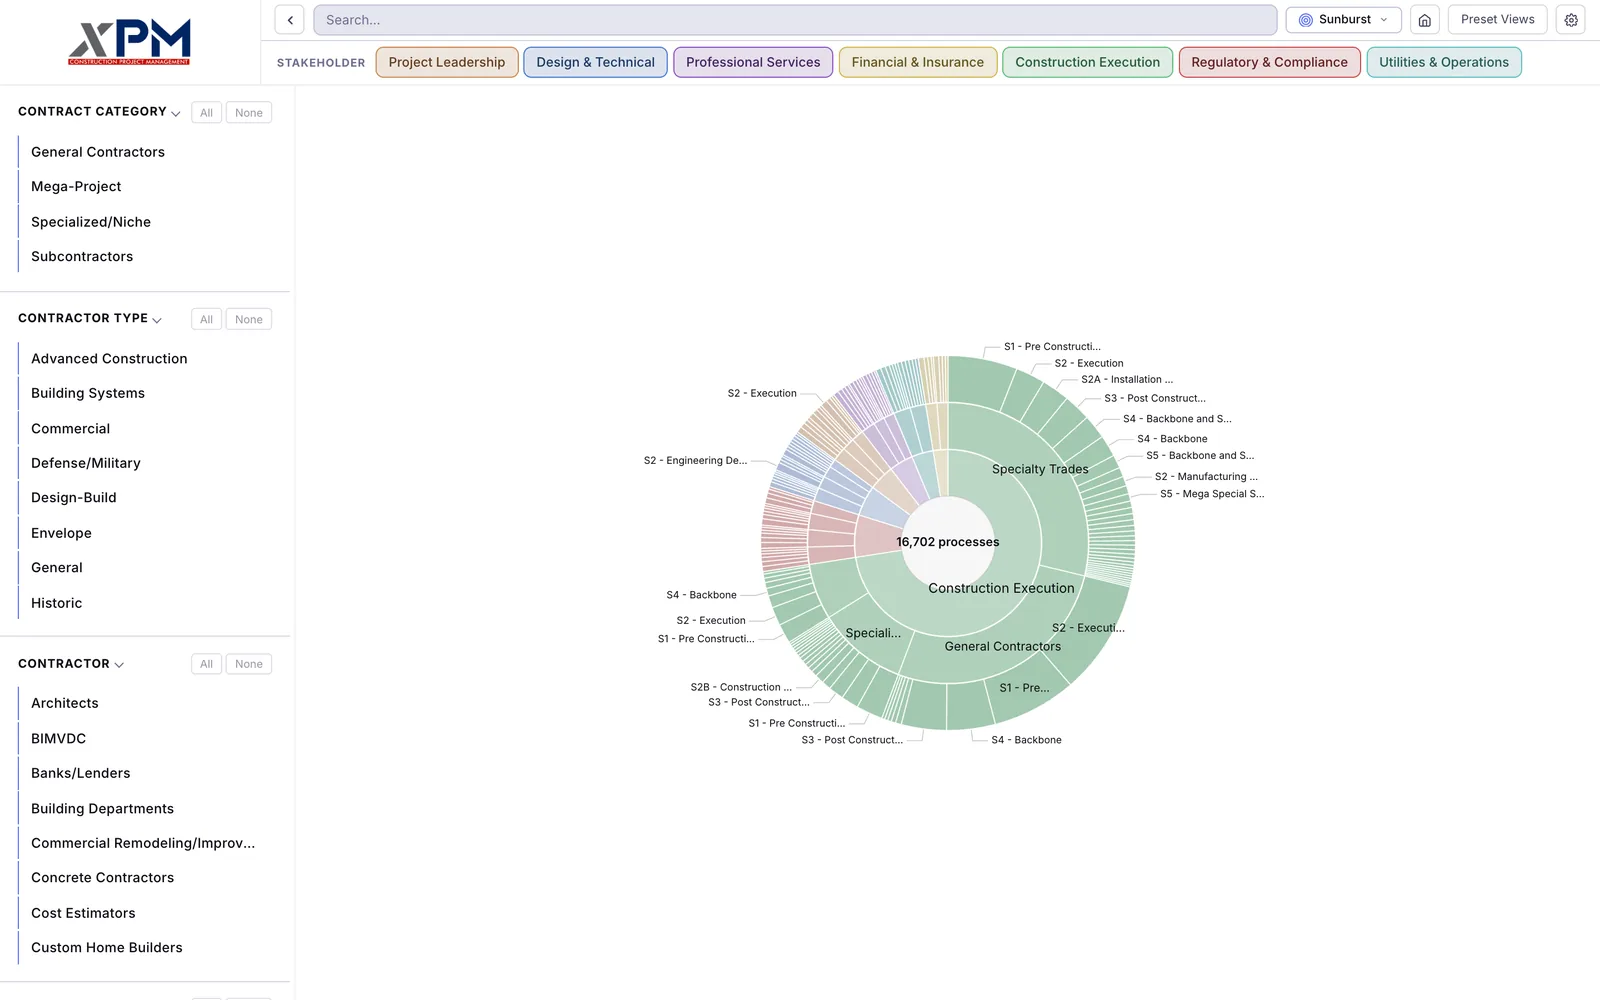
A light page with a pastel sunburst in the middle, mostly green for Construction Execution, General Contractors and Specialty Trades, a process total in the center and small stage labels like S2 Execution and S4 Backbone joined to the rings by thin lines
PL 28The sunburst in the light theme, with the total in the middle and the stage labels pulled outside the rings on leader lines.

Sheet 05 of 09/3D

The graph and the globe in 3D

In the 3D graph each process is a node colored by its stakeholder group. The edges are the folder tree, plus three kinds you can switch on for wiki links, shared tags and links between stakeholder groups.

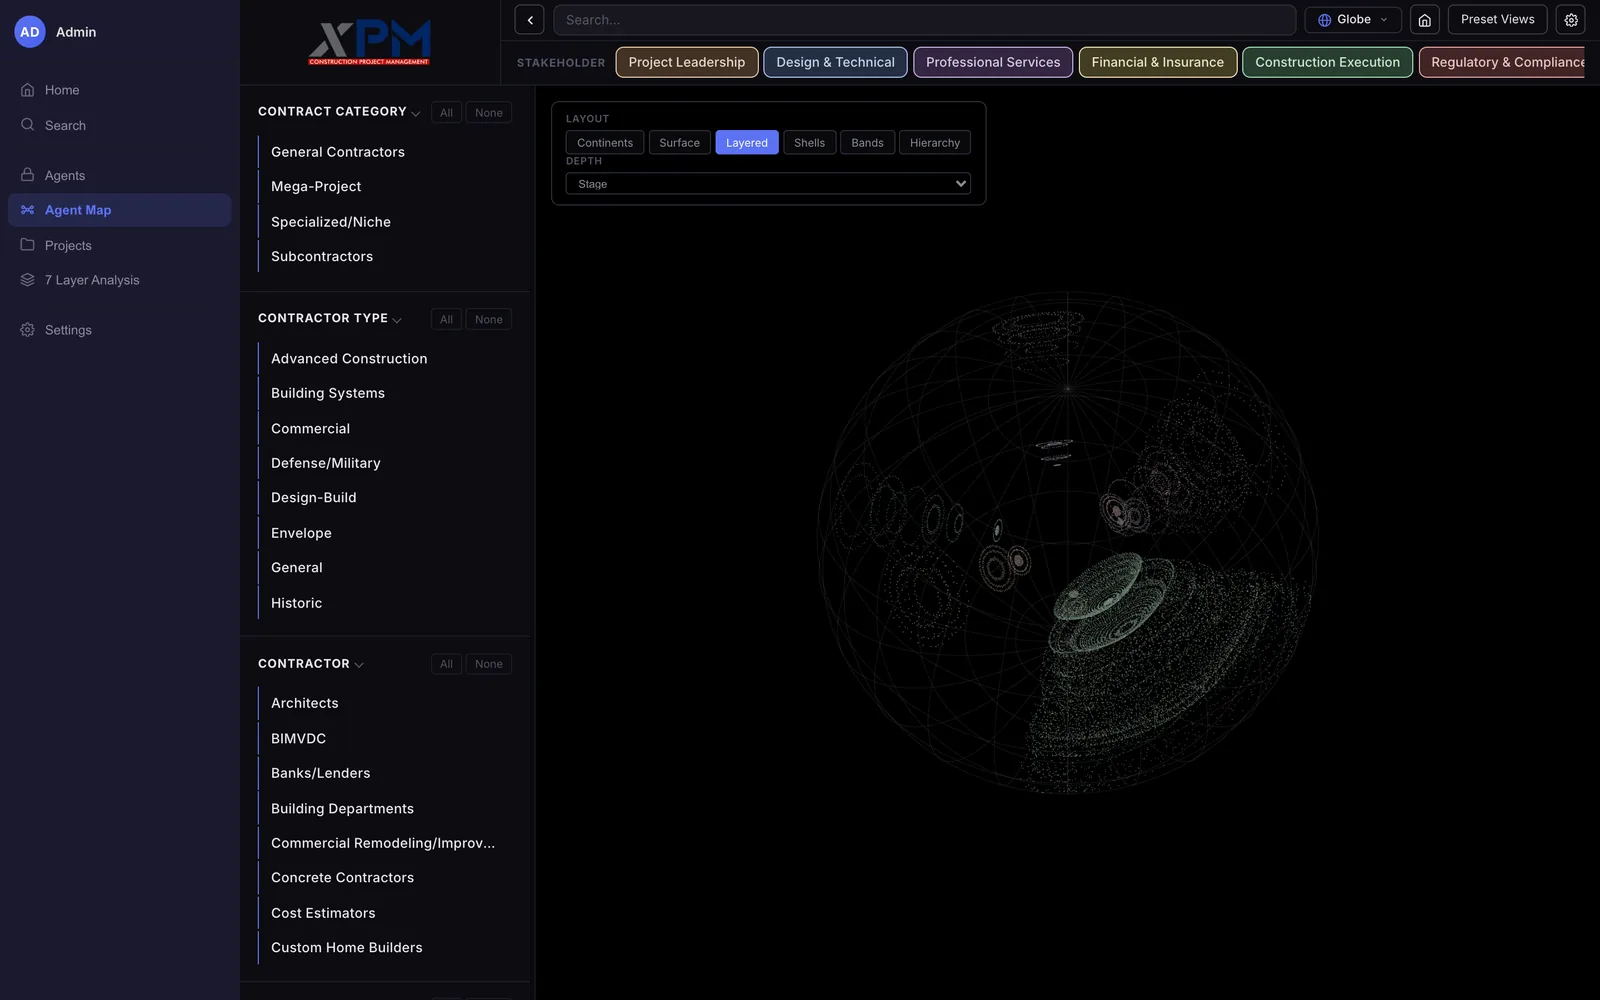
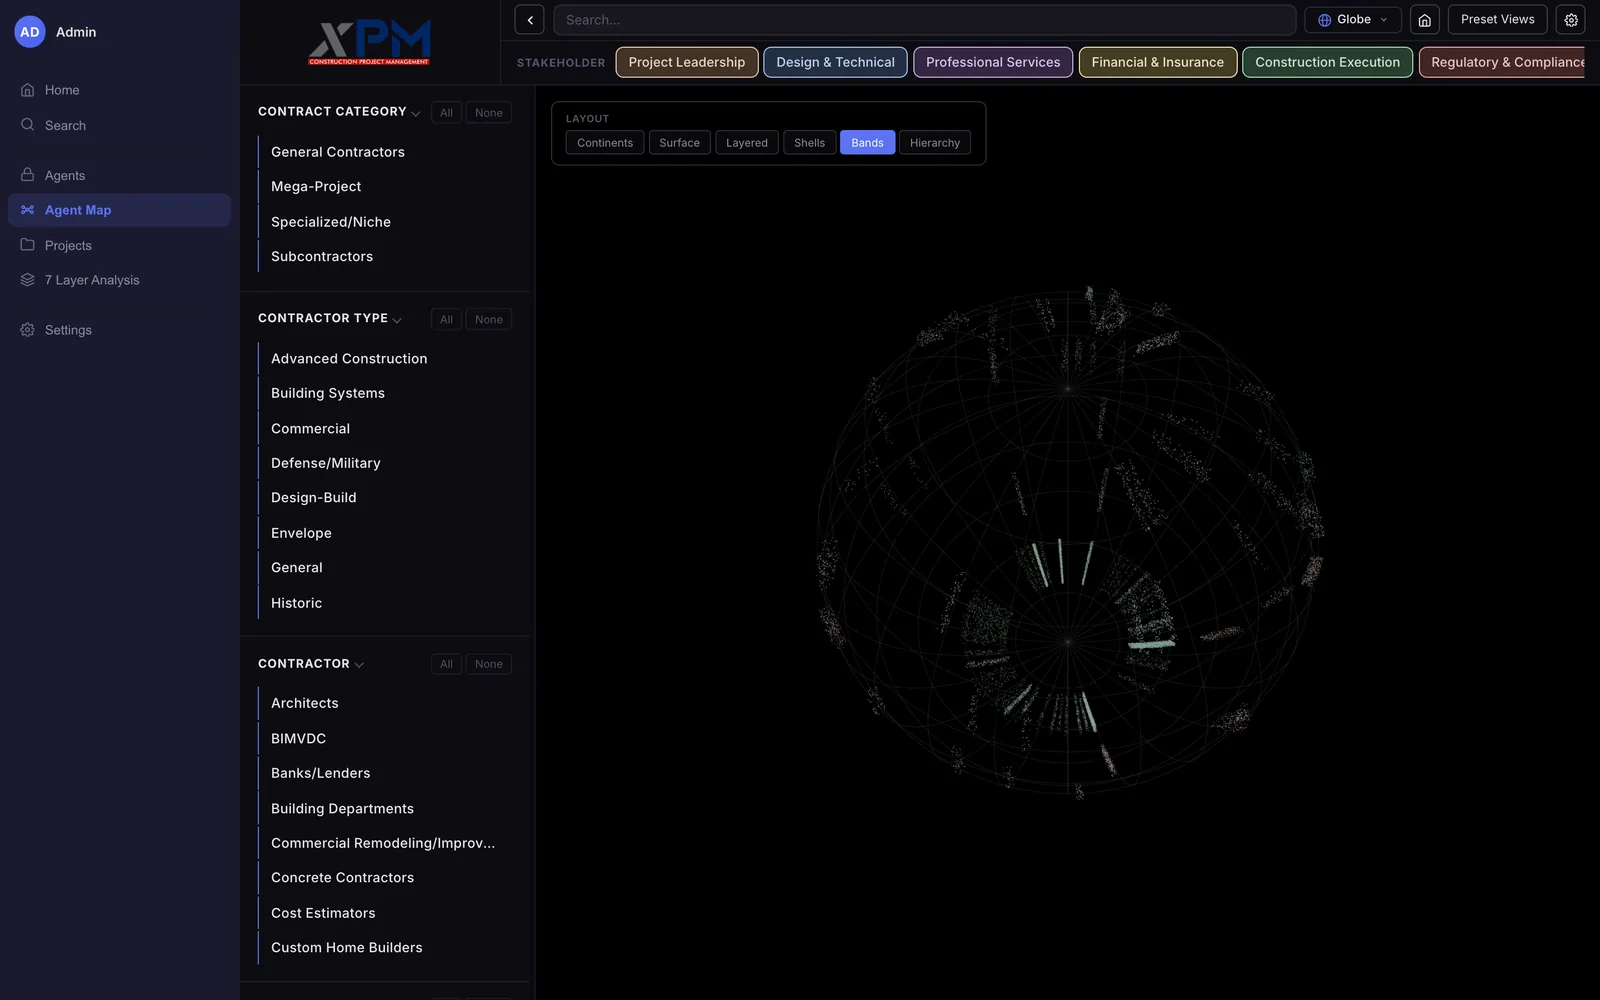
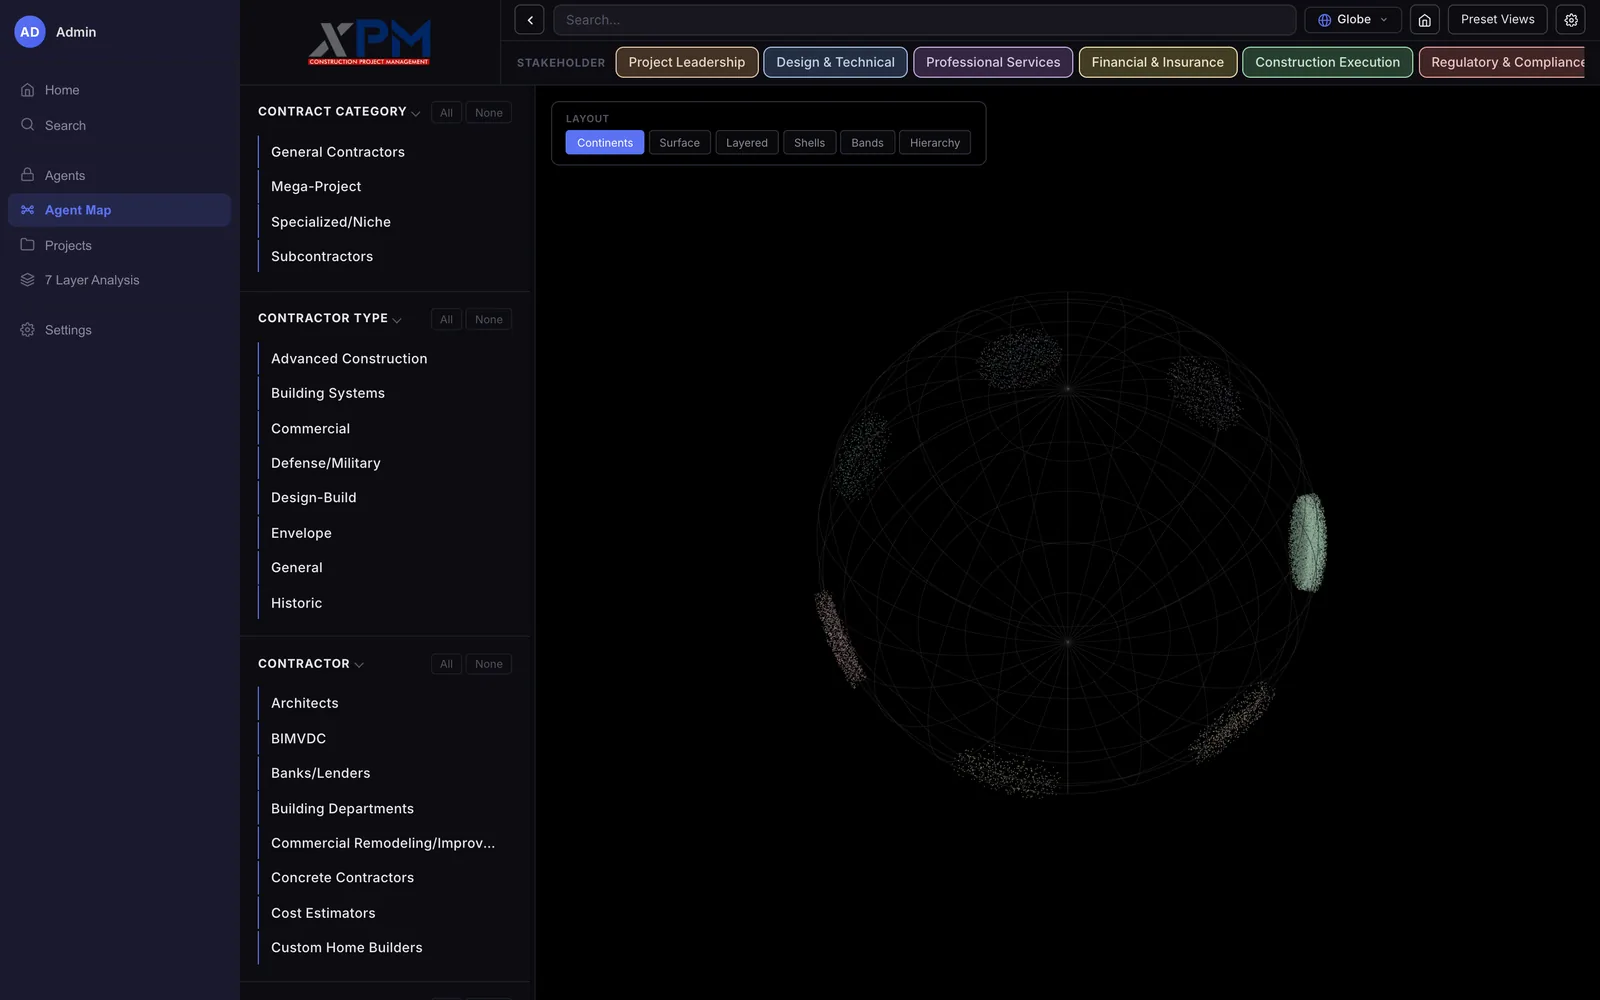
The globe has six layouts and animates between them. In Bands each stakeholder group gets its own band of latitude, with its stages spread around it. Layered keeps each group in one patch and sets how deep each point sits by its stage, or by another field picked in the Depth menu.
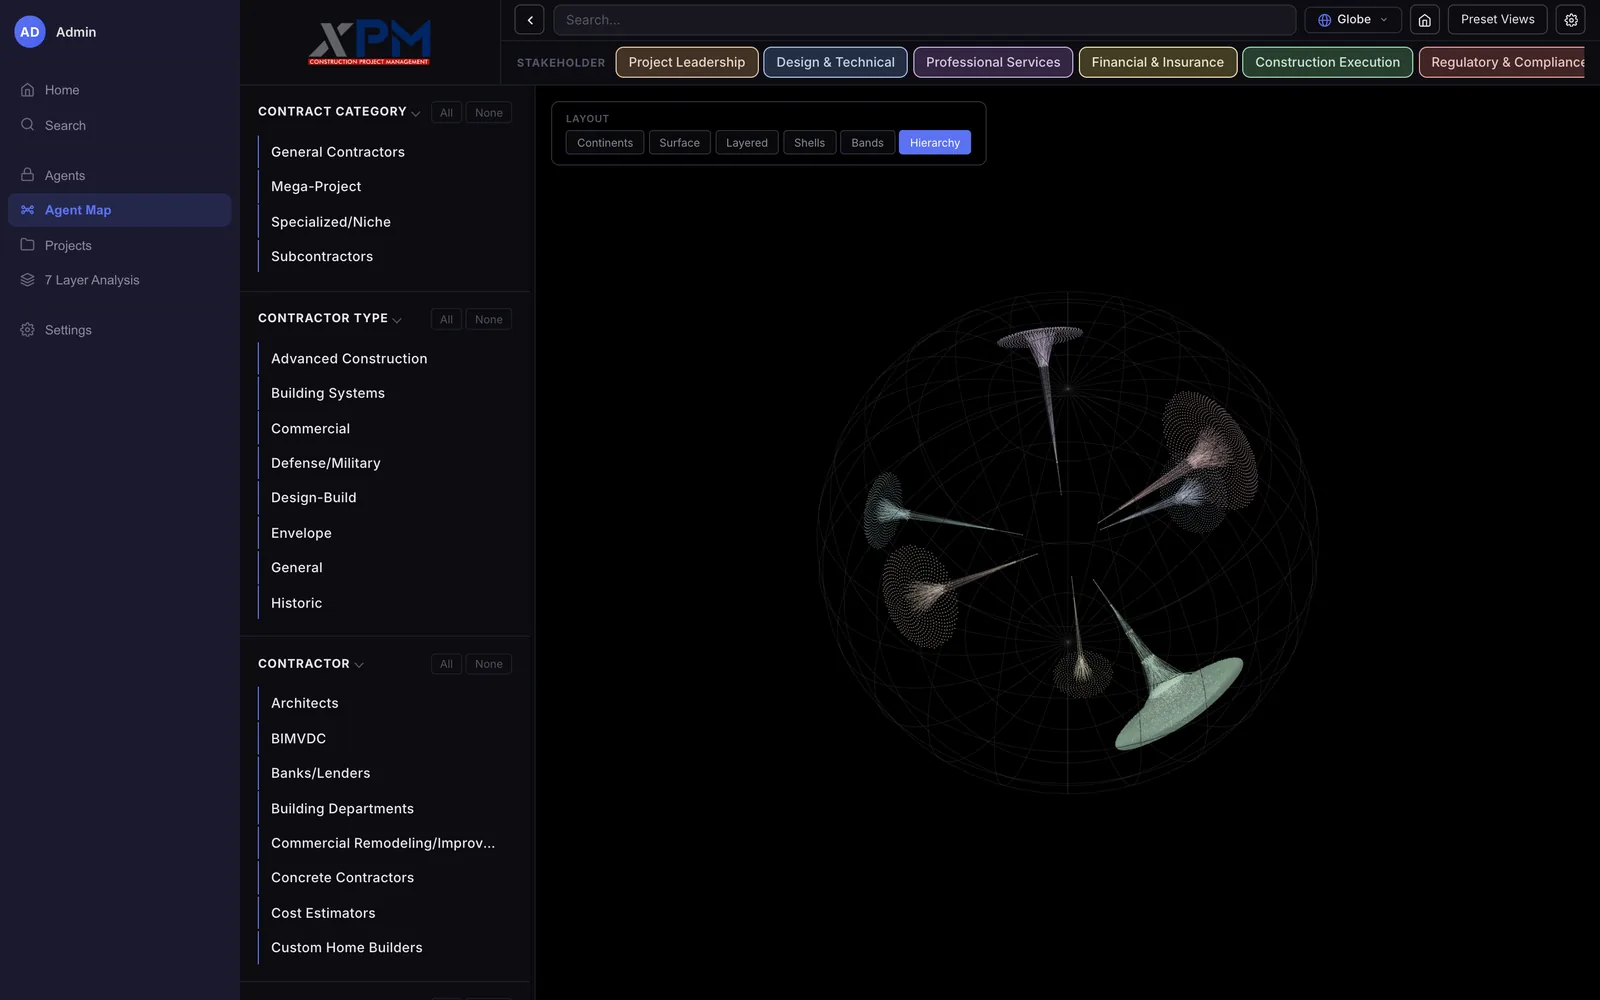
A wireframe sphere on black with funnel shaped clouds of points in pink, teal, blue and green fanning out from its center, next to a layout bar with six buttons
PL 11The globe in its hierarchy layout, with each stakeholder group drawn as a cone of points inside a wireframe sphere. This and the next picture are from the March 30 build.
The wireframe sphere with small patches of points spread over its surface, one a dense green oval on the right edge, and the Continents button highlighted in the layout bar
PL 12The same globe in its continents layout, with the groups spread around the surface. Its six layouts animate from one to the next.
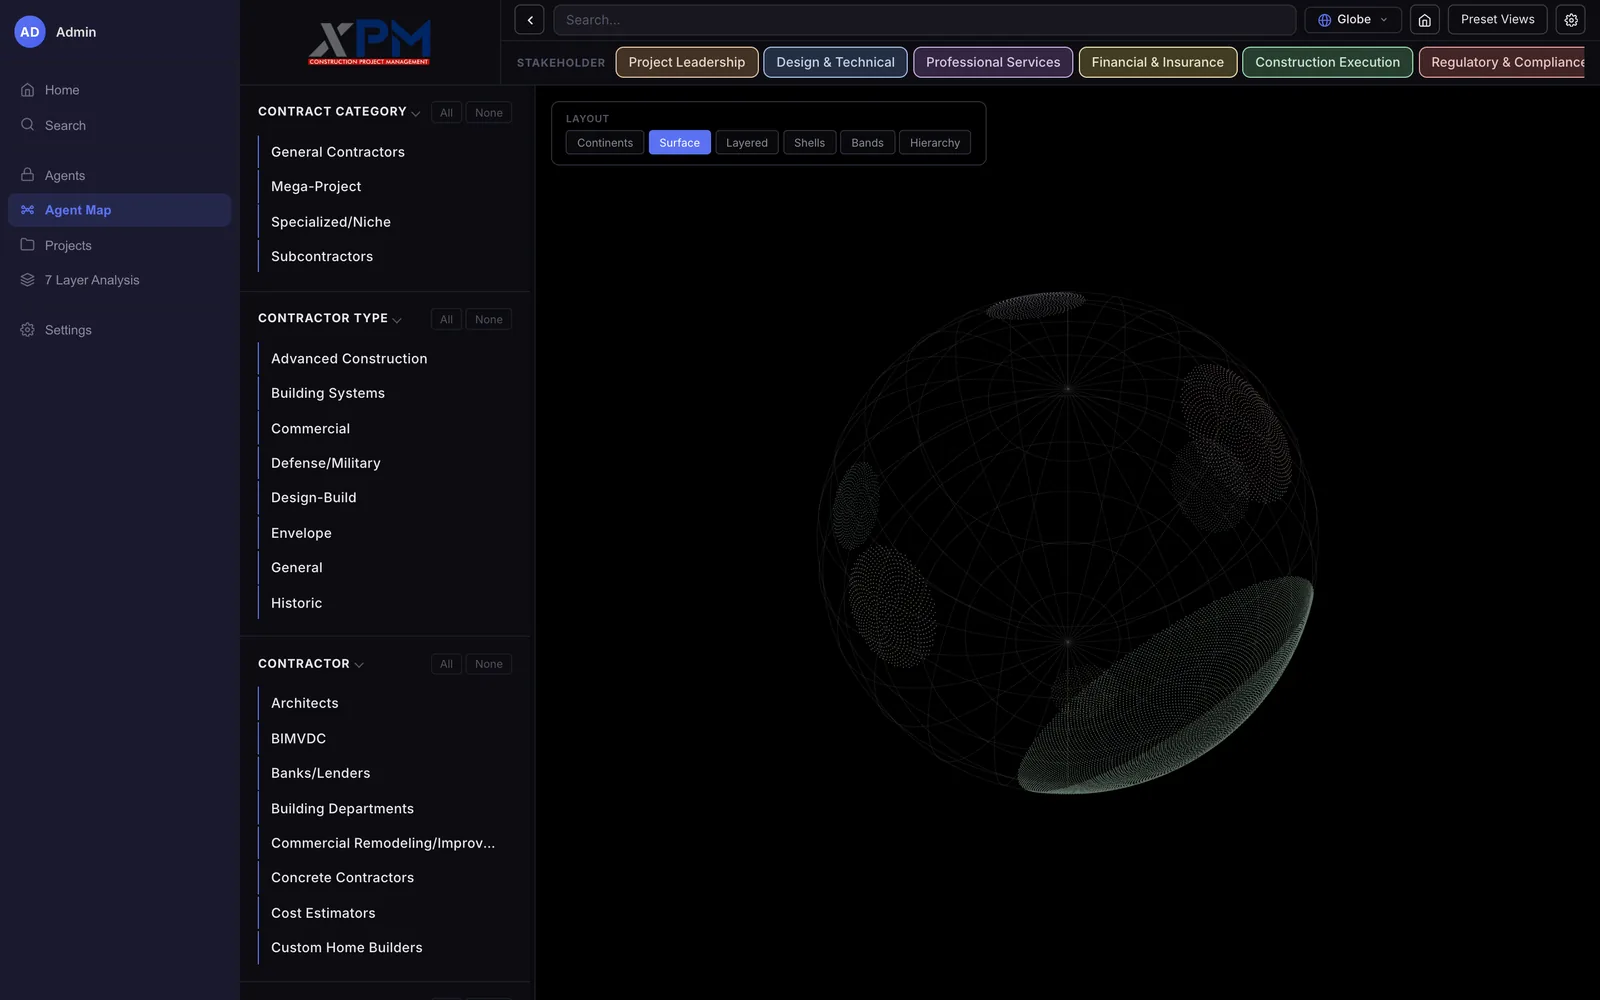
A wireframe sphere on black with round patches of dots on its surface, the largest a dense green dish across the lower right, and the Surface button highlighted in the layout bar
PL 29The globe in its Surface layout, with each stakeholder group packed into one patch on the sphere. This and the next two pictures are from the March 30 build.
The wireframe sphere with stacked rings of dots sinking from the surface toward the middle, a dense green stack at the bottom, and a layout bar with Layered highlighted and a Depth menu set to Stage
PL 30The Layered layout keeps the same patches and sets how deep each point sits by its stage, picked in the Depth menu.
The wireframe sphere with short streaks and scattered clusters of colored dots laid out in rings around it, thicker green streaks near the lower pole, and the Bands button highlighted in the layout bar
PL 31The Bands layout gives every stakeholder group its own band of latitude, with its stages spread around it.

Sheet 06 of 09/Explore

Finding one process

Clicking a node or a table row opens a detail panel with the process code, contractor, stage, tier and the standards it references.

Picking a stakeholder chip narrows the sidebar as well, so it only lists that group's contractors, stages and sub-stages, and every view redraws with just that group.

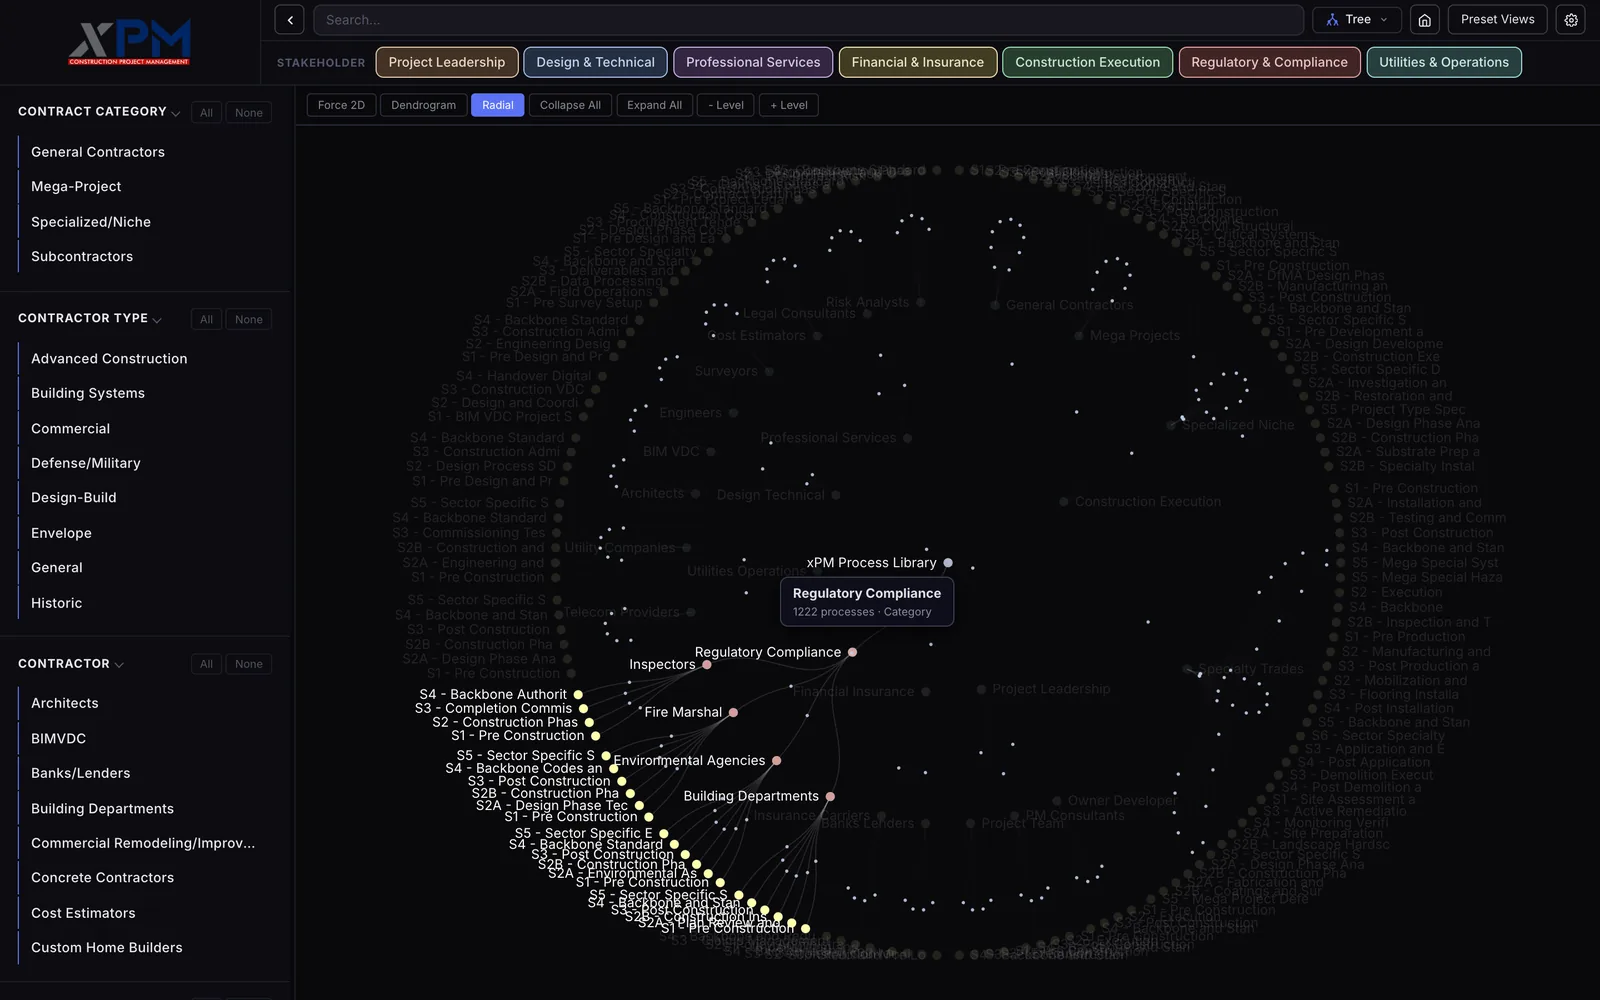
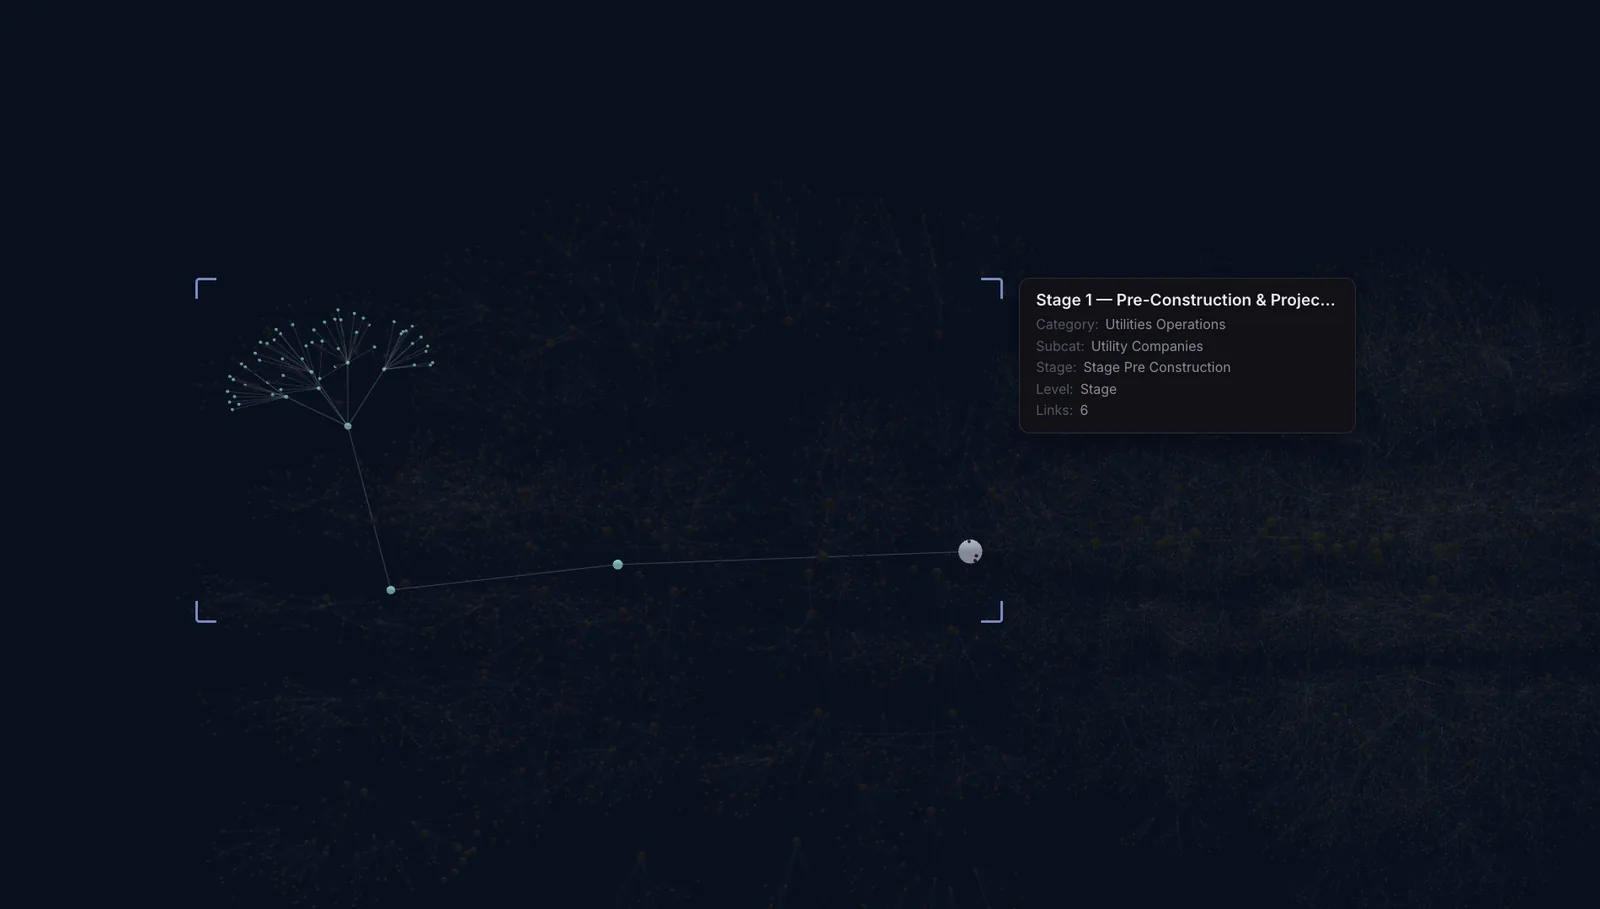
The Explorer Lens dims everything except what you hover. It can show one node, its neighbours or its whole branch, with a card for its category, stage and level. The radial tree has a lens of its own that lights one branch and shows its process count.

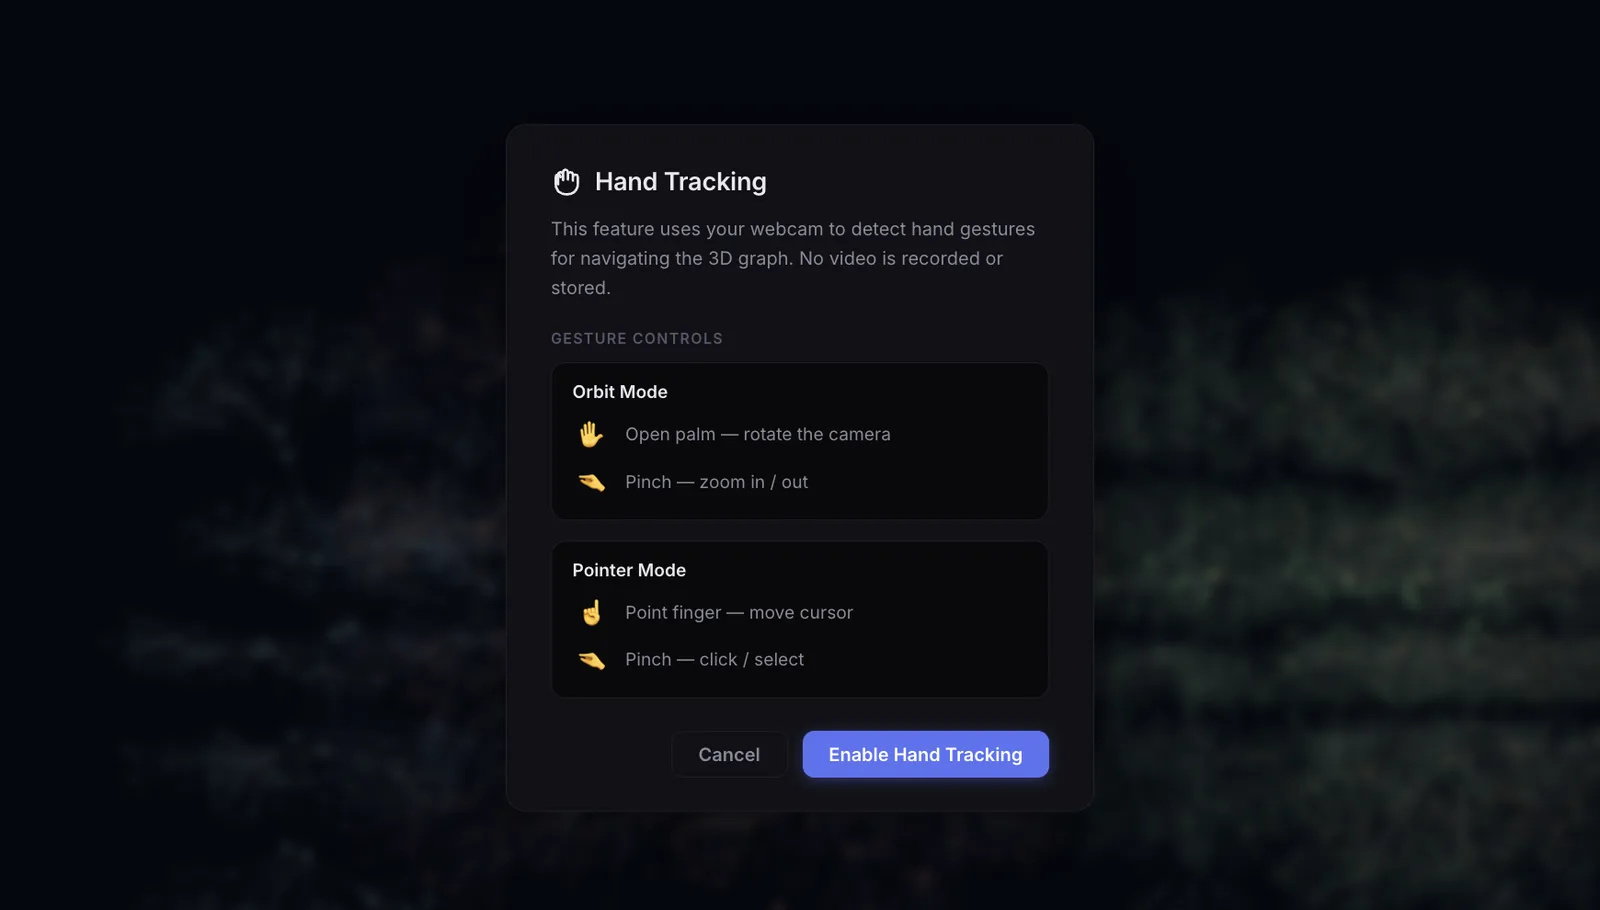
I also built hand tracking with MediaPipe's hand landmark model, which loaded the first time you turned it on. In orbit mode the center of your open palm turned the camera and a pinch zoomed. In pointer mode your index finger moved a cursor and a pinch clicked. A pinch was the thumb tip and index tip less than 0.06 apart in MediaPipe's image coordinates for three frames in a row. It isn't wired into the last build, but the code is still in the repo.
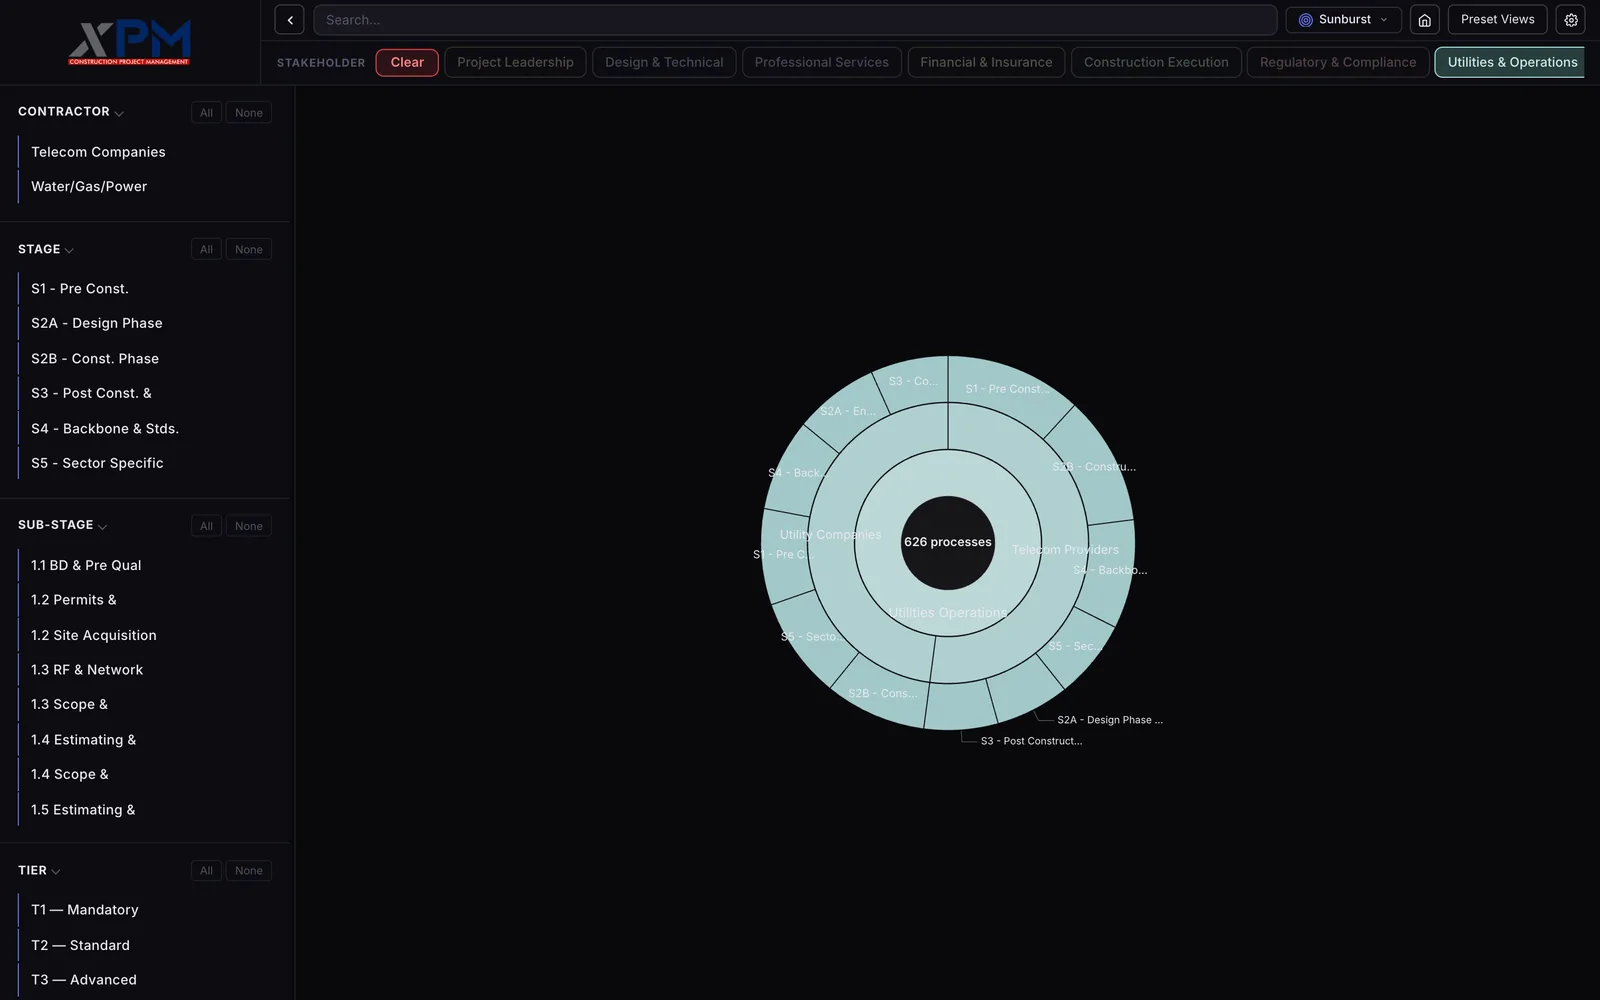
The sunburst cut down to one teal group with 626 processes in the center and Utility Companies and Telecom Providers in the first ring, a red Clear button and one lit chip in the stakeholder bar, and a sidebar listing Telecom Companies, Water/Gas/Power, six stages and sub-stages like 1.3 RF and Network
PL 32Clicking the Utilities and Operations chip leaves its 626 processes in every view and narrows the sidebar to its two contractors, its stages and its sub-stages. Clear puts every group back.
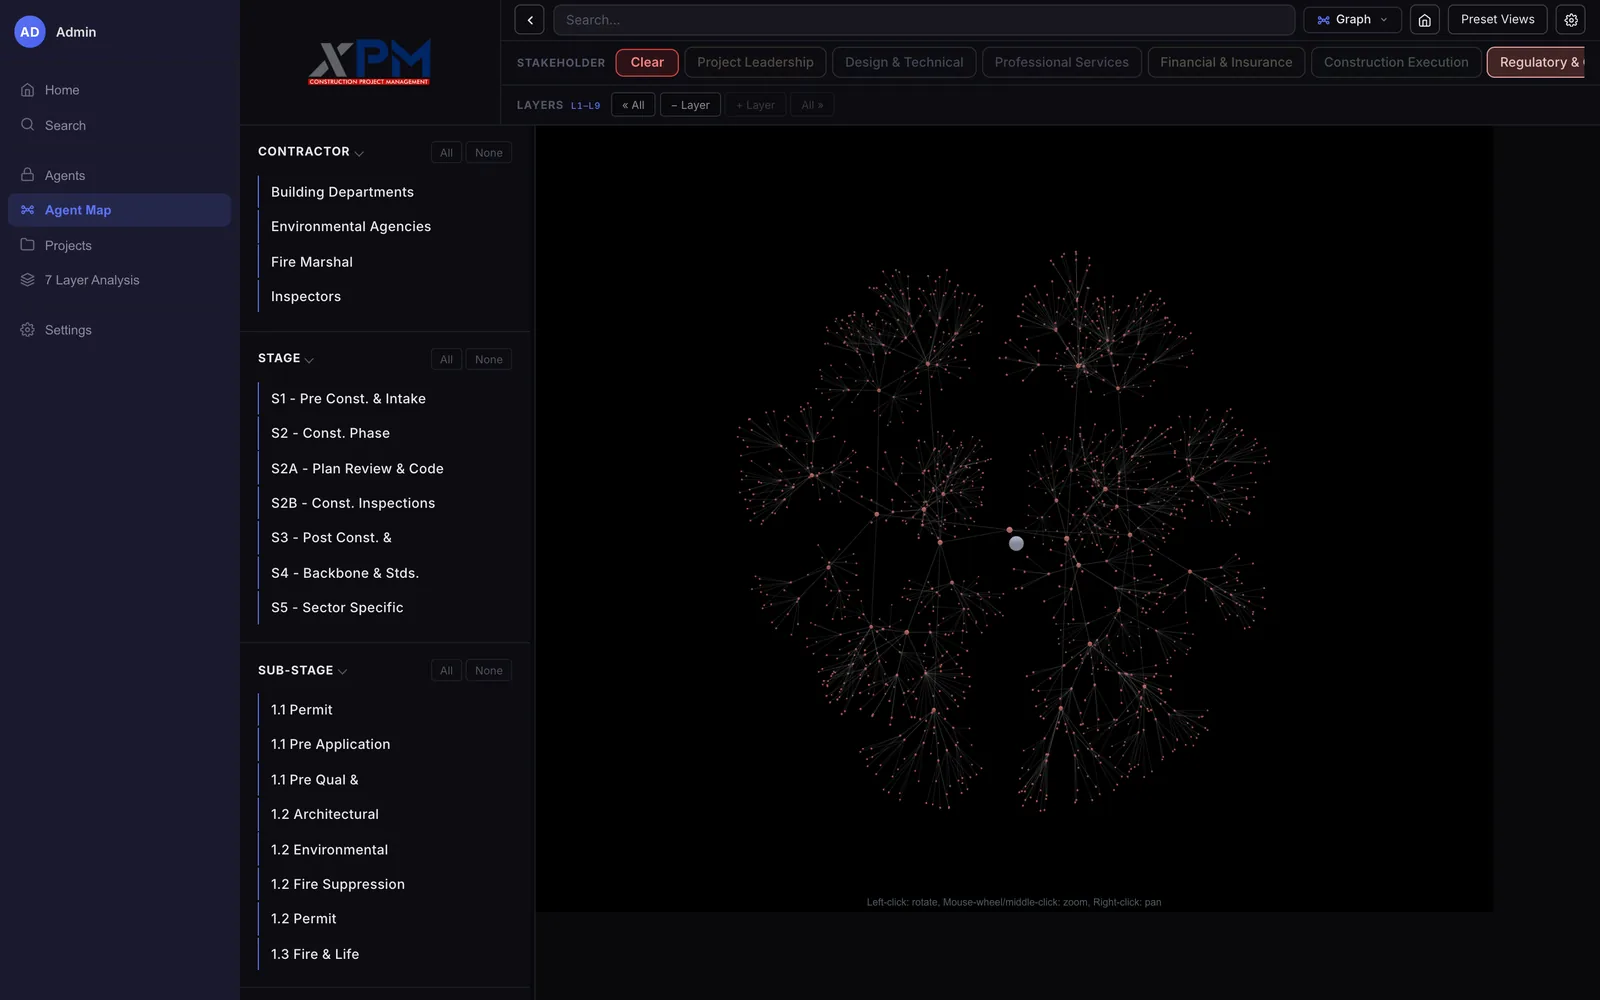
A dark 3D graph of thin grey lines and small pink nodes branching out from one grey root into many fans, next to a sidebar listing Building Departments, Environmental Agencies, Fire Marshal and Inspectors, with the Regulatory chip lit and a layers bar reading L1 to L9
PL 33The 3D graph with only Regulatory Compliance picked and every layer open, and the sidebar down to its four contractors. From the March 30 build, before I moved the graph to G6.
The radial tree with most labels faded to grey and one bright branch from Regulatory Compliance through Inspectors, Fire Marshal, Environmental Agencies and Building Departments to yellow stage nodes, and a card reading Regulatory Compliance, 1222 processes, Category
PL 34The radial tree's lens. Hovering Regulatory Compliance dims the rest of the tree and keeps its branch lit, with a card giving its 1222 processes.
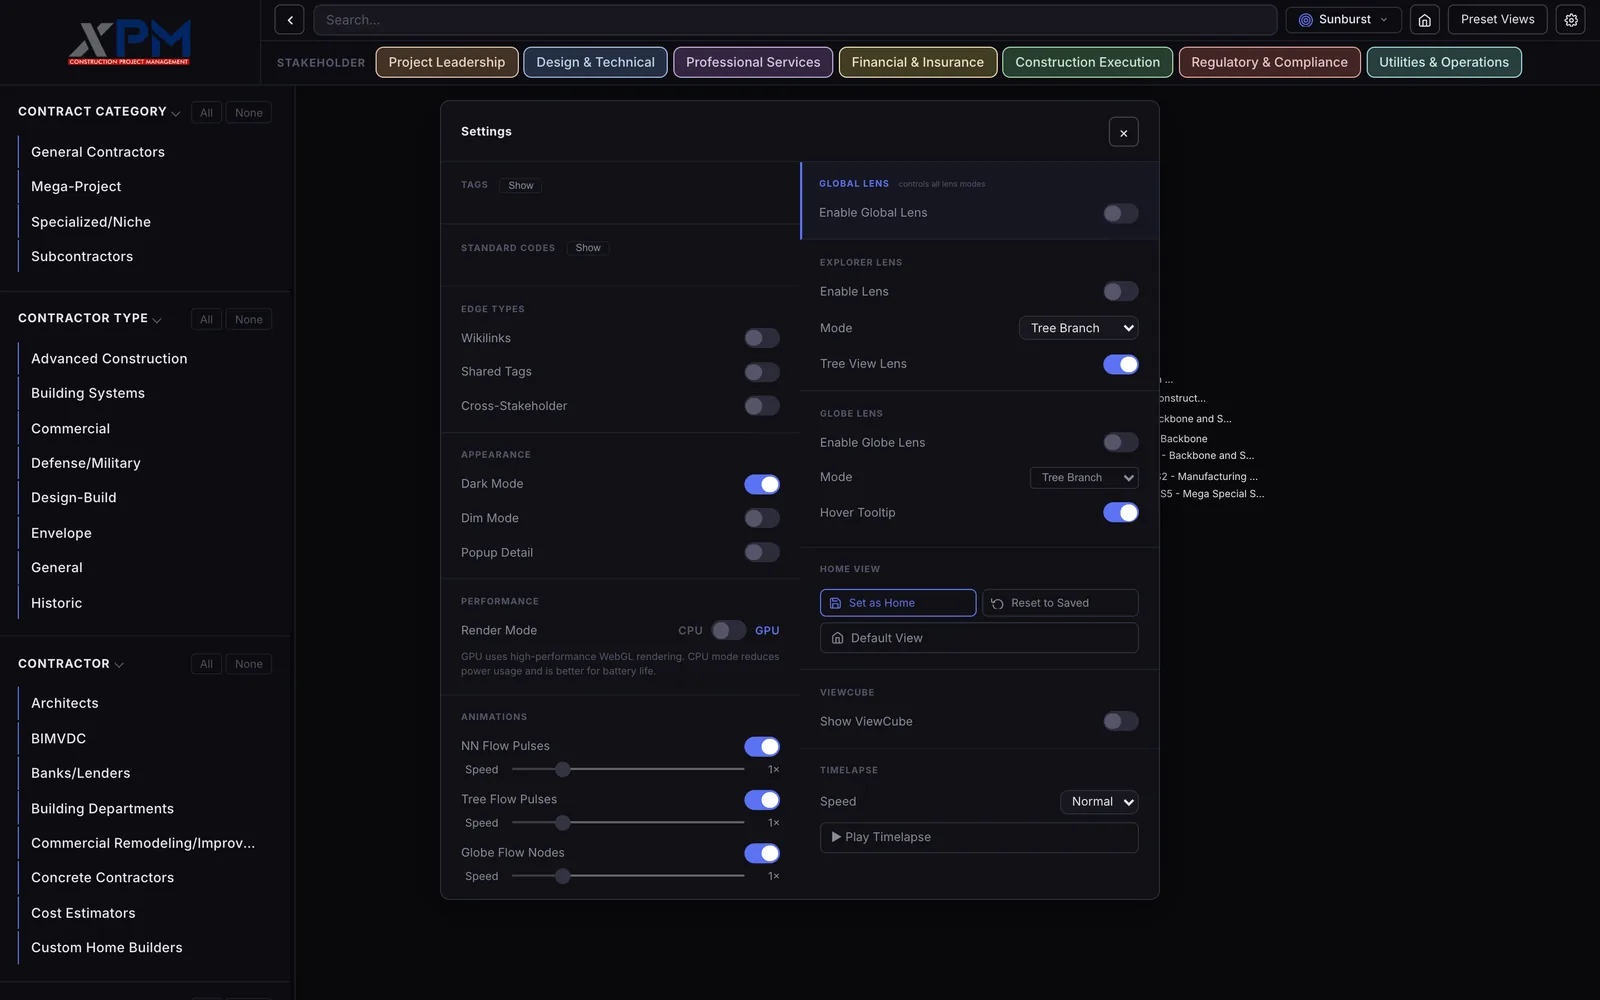
A settings dialog over the sunburst with switches for wikilinks, shared tags and cross stakeholder edges, dark mode, a CPU and GPU render mode toggle, flow animation speed sliders, explorer lens and globe lens options, a home view section and a timelapse speed menu
PL 14The settings panel turns edge types on and off, switches between GPU and CPU rendering, sets the lens modes and saves a home view.
A dimmed dark graph with one bright branch running from a small fan of teal nodes to a grey root node inside corner brackets, and a card beside it reading Stage 1 Pre-Construction, Category Utilities Operations, Subcat Utility Companies, Level Stage, Links 6
PL 15The Explorer Lens in its tree branch mode. Hovering a node dims the rest of the graph and lights its branch, up to the root and down to its leaves, with a card for its category, stage and level. From my March 7 README screenshots.
A dialog titled Hand Tracking over a blurred graph, saying the feature uses the webcam and records nothing, with an Orbit Mode box for open palm to rotate and pinch to zoom, a Pointer Mode box for pointing to move a cursor and pinching to click, and Cancel and Enable Hand Tracking buttons
PL 16The screen that explained the hand gestures before turning on the webcam, from my March 7 README screenshots. Tracking itself needs a camera, so there's no picture of it running.

Sheet 07 of 09/Desktop

A desktop app, then back to the browser

On March 16 I started a desktop version in Tauri, with a Rust backend reading from SQLite. The plan was to stop loading the 25 MB JSON in the browser and ship a Windows installer and a Mac build. On March 30 I took the Tauri backend out again and made it a static web app with a GitHub Pages deploy. On the last day I moved the 3D graph from 3d-force-graph to AntV's G6.

Sheet 08 of 09/Video

Tools for the demo videos

The client sent me some product videos posted on X as examples and wanted clips like them for the app. I planned 33 short clips, 10 to 30 seconds each, recorded in dark mode with music and no voiceover.

First I built a Video Studio inside the app. You describe a demo in a chat, Claude or an OpenAI model turns it into a list of app actions, and the app plays them while it records itself. It's commented out in the last build.

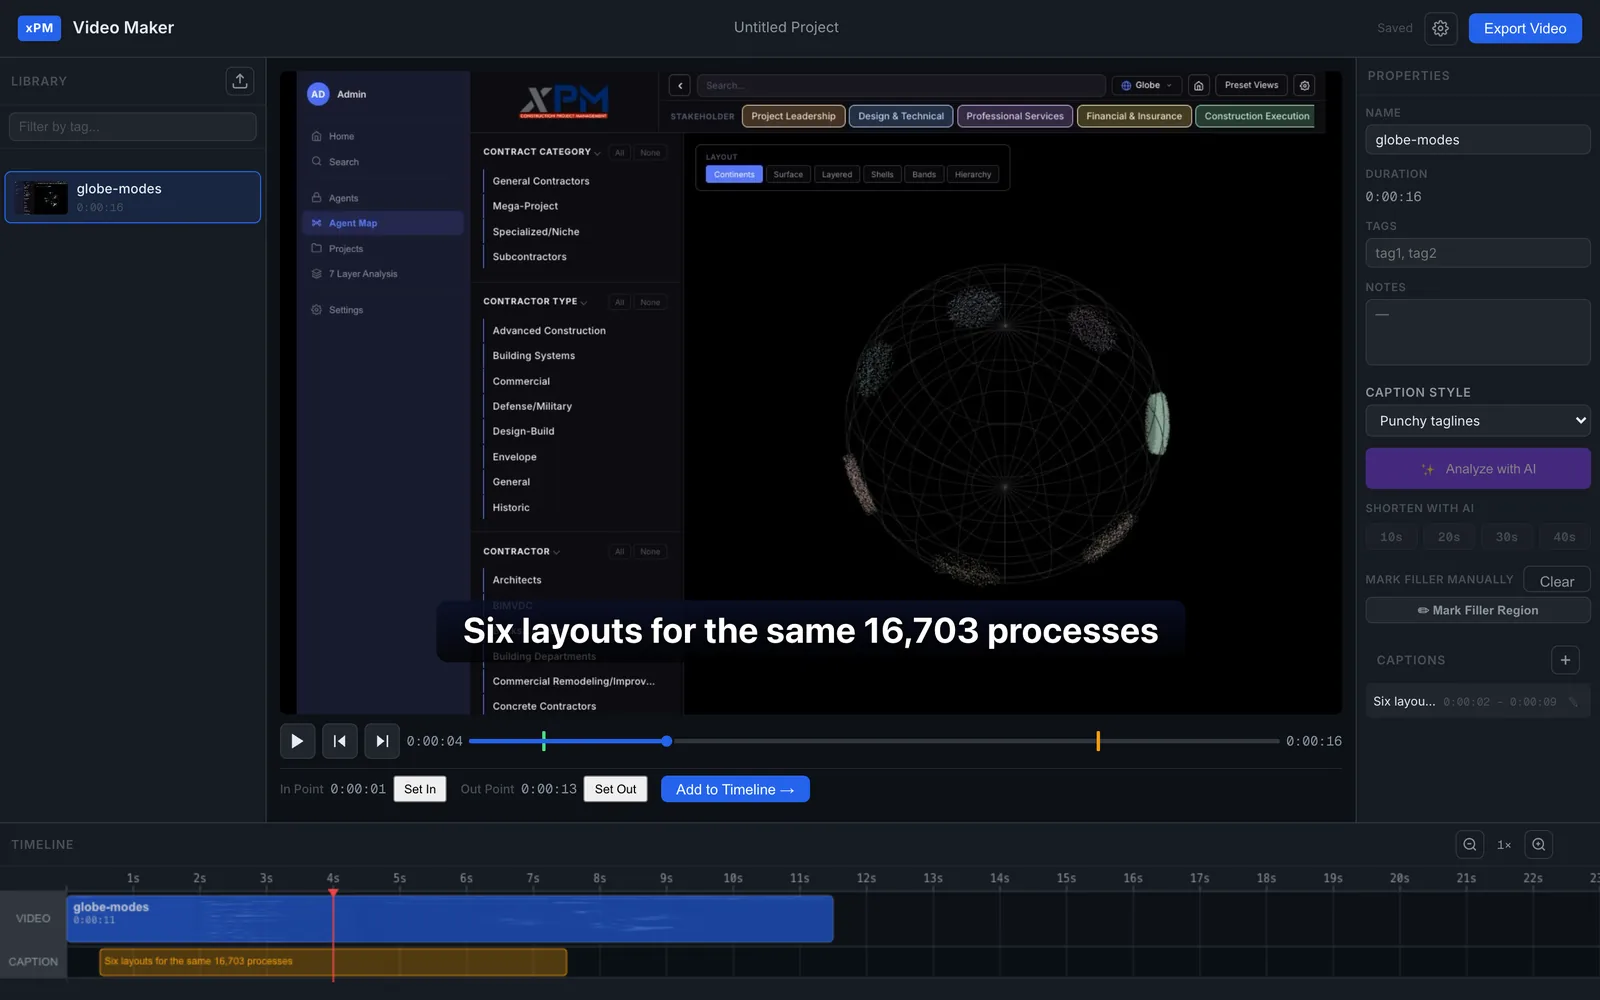
Then I built a separate Video Maker for editing the recordings. It has a clip library, in and out points, a timeline with a caption track, and export to MP4 or WebM through ffmpeg running in the browser. It can send frames from a clip to Claude for a title, tags and captions, or ask it which parts to keep to cut the clip to 10, 20, 30 or 40 seconds. It also flags stretches where the screen stops moving.
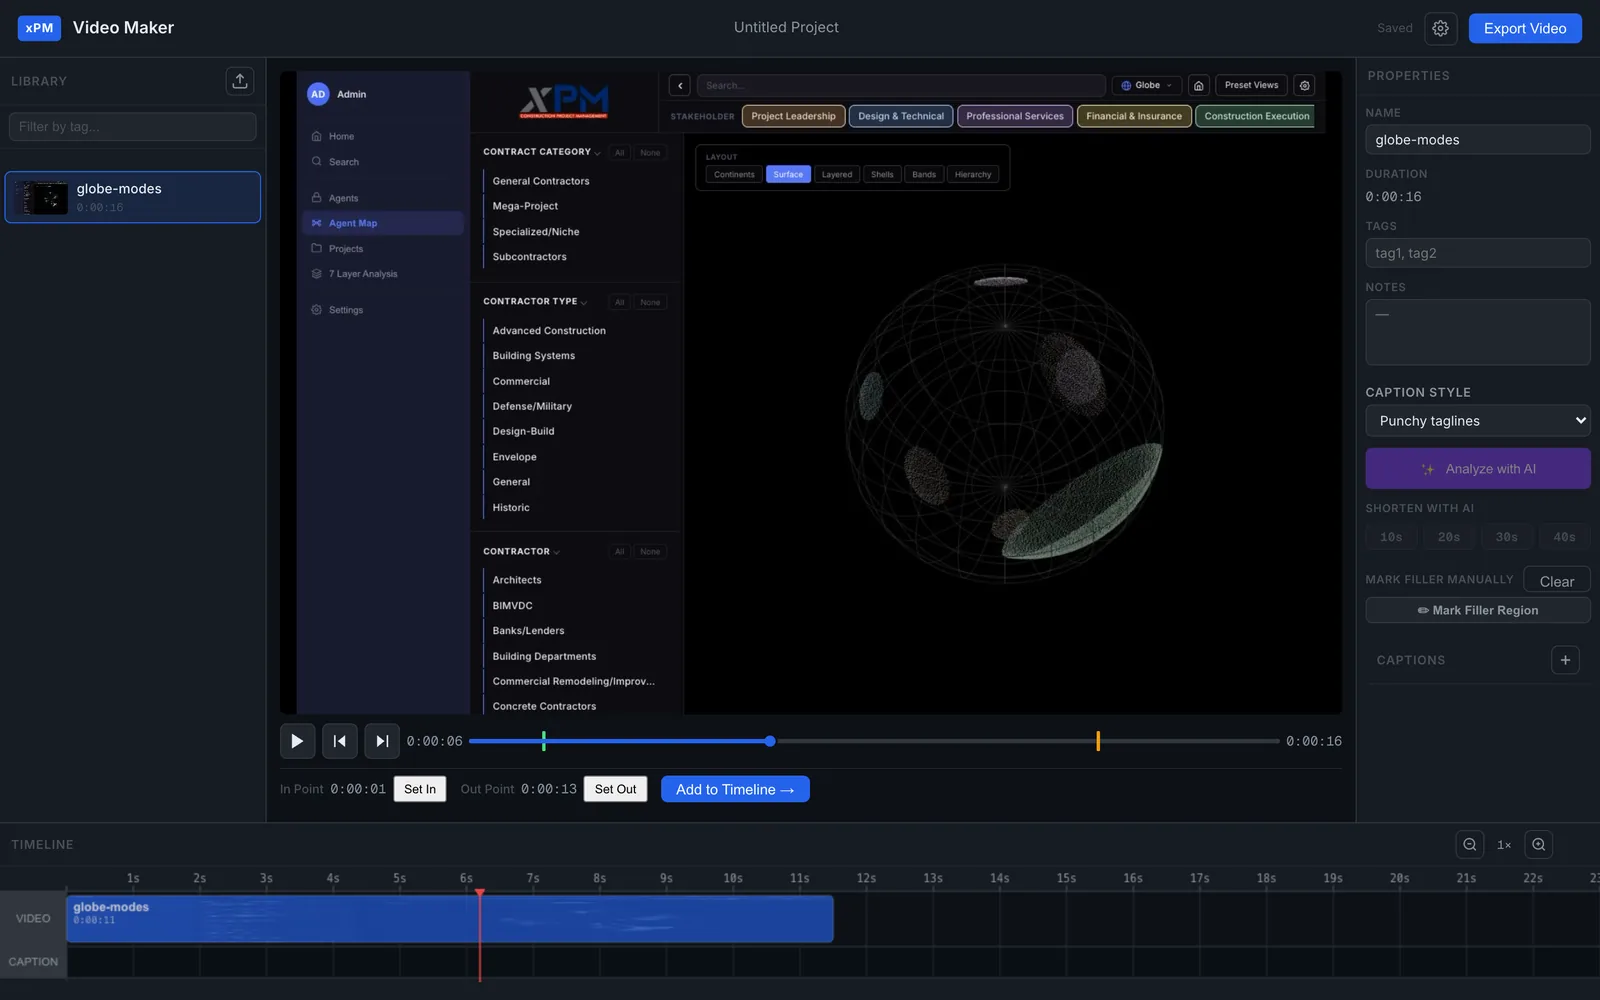
A dark video editor titled xPM Video Maker with a clip library on the left, a player showing the xPM globe view, in and out point buttons, a blue clip on a timeline at the bottom, and a properties panel with caption style, Analyze with AI and Shorten with AI buttons for 10, 20, 30 and 40 seconds
PL 17The Video Maker with a screen recording of the globe loaded, trimmed with in and out points and placed on the timeline. The AI analysis and shorten controls sit on the right.
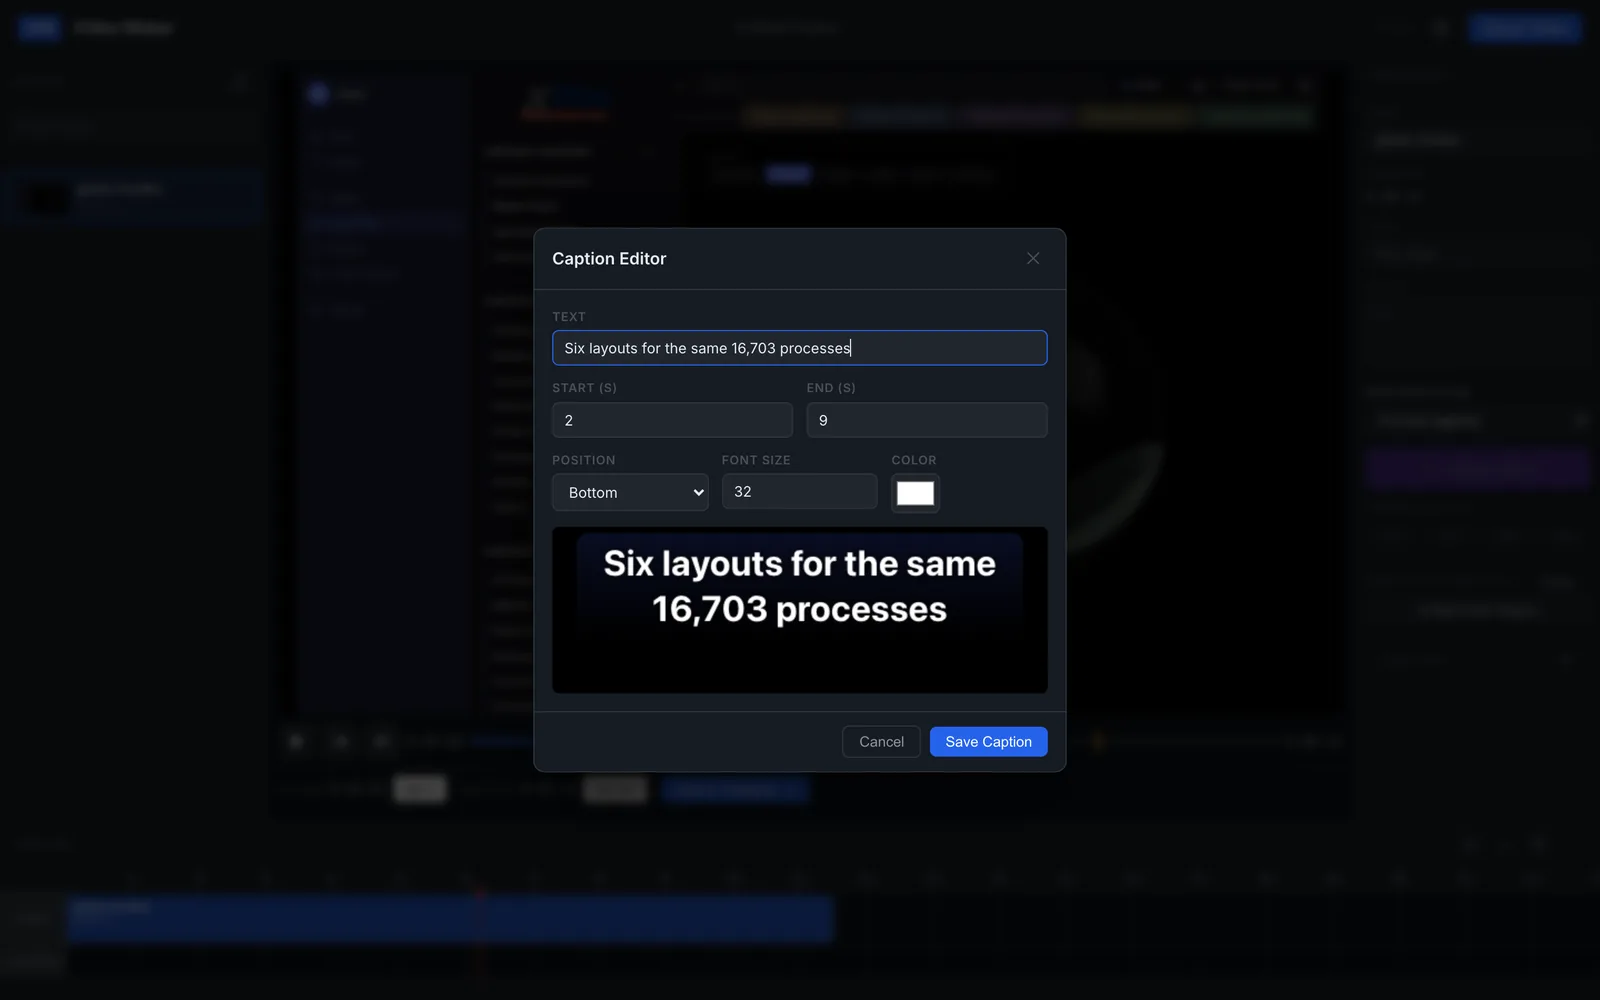
A Caption Editor dialog over the dimmed editor with fields for text, start and end seconds, position, font size and color, and a preview box showing white bold text on a dark band
PL 18The caption editor sets the text, timing, position, size and color, with a live preview. The caption text here is a test typed in for this picture.
The Video Maker player showing the globe recording with large white caption text across the bottom, a captions list entry on the right, and an orange caption block on the timeline below the blue video clip
PL 19The test caption drawn over the recording, and its own block on the caption track under the video.

Sheet 09 of 09/Issues

Known issues in the last build

Search, Agents, Projects and 7 Layer Analysis in the dashboard still say Coming soon, and the chat box on the home page isn't connected to anything. The sign-in page checks the password in the browser, so it only keeps out casual visitors. The layout also doesn't fit a phone screen.

In the last build the globe comes up empty. The last commit swapped in G6 and stopped loading the OrbitControls script, and the globe only aims its camera at the sphere through those controls. The globe pictures on this page come from the March 30 build, the last one before that change.